Showing posts with label COMMODITIES. Show all posts

Wednesday, March 25, 2015

M. Stanley slashes metals outlook on 'dormant' China

M. Stanley slashes metals outlook on 'dormant' China
China's copper imports in February totalled 280,000 tonnes, down by nearly a third from January and the worst drop since 2011.
Customs data also showed imports of iron ore dropped 13.5% to just under 68 million tonnes in February although compared to a year ago there was a gain of 11%.
Coal imports tumbled 9% at 15.26 million tonnes and is down by a third year-on-year.
While seasonal factors played a role in the magnitude of the declines, the "new normal" of slower growth rates in China will continue to put downward pressure on commodity prices says Morgan Stanley in a new research report.
Instead of delivering its reliable first-quarter seasonal expansion in trade, China’s metal processing industry remains dormant
Bloomberg Business reports the investment bank has slashed its forecast across a range of metals and minerals with nickel estimates taking the worst drubbing:
“With only months left before the mid-year peak in sales of commodity-intensive goods, time is running out for China to support commodity prices in 2015,” the Morgan Stanley analysts wrote in the report. "Instead of delivering its reliable first-quarter seasonal expansion in trade, China’s metal processing industry remains dormant.”
Morgan Stanley new forecast for the nickel price is 19% below its previous estimates for the year at $16,094 a tonne, which is still sharply higher than today's ruling price of $14,175.
The bank cut its 2016 outlook for copper by 14% to $6,283 a tonne on the back of a global copper surplus of some 230,000 tonnes, compared with a balanced market last year.
Copper held onto its recent gains trading at a three-month high above $6,000 on Tuesday despite news of operations at the Grasberg mine in Indonesia returning to normal after a 5-day blockade by workers that lifted the price.
The bank's 2015 forecast for iron ore was brought into line with the ruling price in the mid-$50s. Morgan Stanley now believes the price of the steelmaking material will average $57 a tonne in 2015 before recovering to $65 a tonne next year and $71 in 2017.
Both those estimates were below previous forecasts thanks to seaborne supply exceeding demand by 129.3 million tonnes in 2017 from an estimated 55 million tonnes this year.

Tuesday, March 10, 2015

Hedge funds cut bullish commodity bets to 6-year low

Hedge funds cut bullish commodity bets to 6-year low
Large scale speculators in gold futures added massively to short positions – bets that prices will fall – ahead of Friday's jobs report in the US which sent gold prices tumbling.
On Monday the gold price regained some of its footing, but is still trading at the lowest since November after retreating more than $140 an ounce from its 2015 high above $1,300 hit in January.
On the Comex division of the New York Mercantile Exchange, gold futures for April delivery – the most active contract – was last trading at $1,166.40 an ounce, up $2.10 or 0.2% from Friday's close.
Silver futures trended weaker on Monday with May contracts recovering from a day low of $15.71 an ounce to exchange hands at $15.79 an ounce in early afternoon trade. Like gold, silver went off to the races at the start of the year to hit a 2015 high of $18.36 on January 22, but has since given up most of those gains.
The precious metals' break in upward momentum is evident in the futures positioning of large investors like hedge funds or so-called "managed money".
Large scale futures investors cut bullish exposure to 24 commodities by 29% during the week
Net long positions of gold – bets that the price will go up – held by hedge funds surged in January to 167,693 lots or 16.7 million ounces to hit the highest level since 2012 when gold was trading north of $1,700 an ounce.

But in the week to March 3 according to the Commodity Futures Trading Commission's weekly Commitment of Traders data bullish positioning was trimmed for the fifth week in a row.
Hedge funds increased short positions on gold – bets that prices will fall – by 18% and cut long positions at the same time, reducing the net long position by 15% to 8.8 million ounces.
Silver positioning also turned bearish last week with speculators adding 32% to short positions and scaling back longs for a net bullish position of 103 million ounces, down nearly 30% from last week.
Like the price of silver, speculation in silver futures tend to be volatile. Hedge funds had to cover a net short position of 53 million ounces in October last year after pushing longs to a record of 234 million ounces only three months earlier.
It's not only precious metals that have fallen out of favour with hedge funds.
Large scale futures investors cut bullish exposure to 24 commodities by 29% during the week. Across all sectors – from soybeans and diesel to lean hogs and palladium – net-long were run down to just 451,000 lots of futures and options.
Sentiment on commodity markets has not been this bearish since March 2009 during the global financial crisis according to data from Bloomberg and Saxo Bank.

Friday, January 23, 2015

World Bank: Commodities falling like it's 1985

World Bank: Commodities falling like it's 1985
This year may well see a rare occurrence for world commodity markets – a decline in all nine key commodity price indices, says the World Bank’s latest Commodity Markets Outlook, released on Thursday.
Oil prices have seen the most dramatic decline with iron ore a close second, but all commodity categories except beverages and food other than grains, oils and fats were softer last year. This broad-based weakness is expected to continue throughout 2015 says the bank.
Oil enjoyed a rare up day to trade at $47.50 on Thursday after news of the death of the Saudi king, but prices are still down 56% from the most recent high of $108 per barrel in mid-June 2014.
The forecast 3% decline in precious metals will result mainly from waning interest by institutional investors
That's the third largest decline since World War II – previous records of a 7-month decline of 67% were set in 1985–86 and during the global financial crisis in 2008 which saw a 75% drop.
The proximate causes of the steep drop in oil prices, however, have two key similarities with one previous episode according to John Baffes, Senior Economist in the World Bank’s Development Prospects Group:
"Both the current oil price collapse and the one experienced in 1985/86 followed an increase in oil production from unconventional sources and OPEC’s abandonment of price targeting."
The World Bank forecast sees oil prices averaging $53 per barrel in 2015, 45% lower than in 2014. The weakness in oil prices is likely to impact trends in other commodity prices, in particular those of natural gas, fertilizers, and food commodities.
Metal prices are forecast to drop 5.3% in 2015 compared to a 6.6% fall in 2014, while more moderate declines are foreseen for fertilizers and precious metals. A pullback of 2.9% in precious metal prices will result mainly from waning interest by institutional investors.
The moderation in natural gas prices is expected to lead to a 2.1% decrease in fertilizer prices according to the report.
According to the organization next year a recovery in the prices of certain commodities may likely get underway "although the increases will be small compared to the depths already reached."

Thursday, December 25, 2014

Supply plays key role in 2014 global commodity market

Supply plays key role in 2014 global commodity market
The Chief Executive of Glencore one of the world’s top resource company, Ivan Glasemberg, stated that, the demand for the metals hasn't been bad this year.
He added that, the demand for oil, iron ore and also coal is growing, but the price of these materials is not progressing soon enough. He stated that, the reason behind the lagging of price for the commodities is that, the companies including Glencore has been investing largely in their projects, expanding the production, which finally lead to crisis.
Supply of commodities played a key role in the global market of metals this year. It was the judge to determine the winners and losers based on every market, starting from iron ore to nickel . Supply is also the reason why the commodities are performing at the worst for the third consecutive year.
According to the analysts, this trend could continue to follow the market for the year 2015, as none of the iron ore producers and the oil producers are showing signs to decline their rate of production for the next year.
According to the recent report published by the Citi Bank, the analyst stated that, it is too easy to assume that the main problem regarding the commodity market is the global growth of GDP. But actually the problems regarding the supply are the main issue which creates gluts in the market. The worst effect of supply can be seen in iron ore, as the metal has been marked as the worst performing metal of the year.
Iron ore, which is commonly known to be the key ingredient in the procedure of steel making, has declined over 50 percent in its value, which is noted to be five year low, due to the increase in the supply of iron ore, mainly from the mines of Australia. The increase in supply declined the demand of the commodity in the Chinese market.  

Friday, November 28, 2014

CHARTS: Dollar destruction of commodity prices could be ending

The gold price drifted lower on Thursday falling below $1,200 and down nearly $10 overnight, hurt by a 6% slide in the price of oil.
The two commodities often move in tandem because cheaper crude leads to lower inflation, tarnishing gold attractiveness as a hedge against faster rates of price growth.
The fall in the price oil has given another boost to the US dollar. Commodities priced in US dollar usually have an inverse relationship to the world's reserve currency.
The greenback's rise to near five-year highs against a basket of currencies has pressurized not on the price of gold, but everything from copper and cotton to milk and molybdenum.
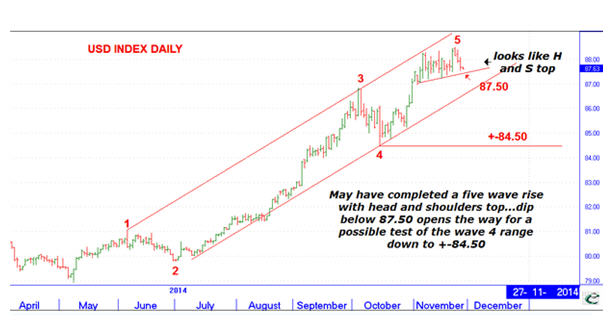
InvesTRAC passed on this price graph to MINING.com indicating that the US dollar's stunning run since May may be close to correcting.
The technical research and investment blog notes the advance from the May low has "unfolded in five waves which ought to be followed by a three wave correction":
The top of wave 5 seems to be tracing out a head and shoulders top and a dip through 87.50 would open the way to violate the uptrend and teat the bottom of wave 4 at 84.50. The technical picture shows InvesTRAC's short term direction indicator has turned down from an overbought situation with the forecaster showing weakness could be expected until the last week of December. So the stage is set for declining dollar and rising to soon get underway.
CHART: Dollar destruction of commodity prices could be ending
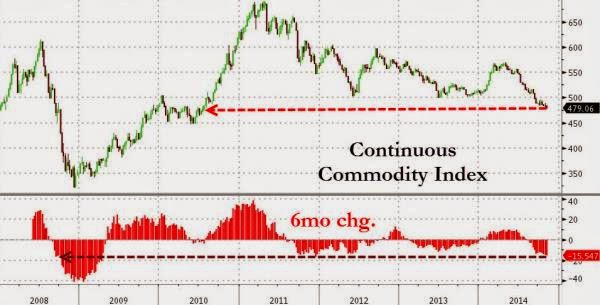
InvesTRAC believes the dollar chart confirms movements in the CRB Commodities index and that the decline in the broader commodities index from its June high was probably terminating after a 15.5% decline.
The InvesTRAC short term model shows that the OB/OS indicator has just begun to rise with the forecaster showing a rising ternd into early February. The daily chart below shows a 15 percent rise form the January lows which has more than been taken back by the second half slump…the index has ticked up slightly and is encountering the downtrend with a massive divergence on its RSI. My conclusion is that the worst is over and that we should now (or very soon) see the hard hit commodity prices lifting off their lows.
CHARTS: Dollar destruction of commodity prices could be ending

Wednesday, November 19, 2014

China Home Price Slump Sends Iron Ore Plunging To 2009 Lows (-50% In 2014)

Iron Ore prices crashed below the critical $70/mt level overnight, lows not seen since the bottom in 2009, as China's home prices fell for the second month in a row, accelerating losses. Average property prices across China dropped 2.6% YoY in October (a bigger drop than September's 1.2% YoY slip) withonly 1 out of 70 cities seeing any positive price change (Zhengzhou +0.2% MoM). What is perhaps most entertaining is the 38.6% YoY rise in new home starts China just experienced - the biggest jump ever - as the first sign of demand (or hint from PBOC that they would 'help' with mortgages) and supply floods the market. The 'market' appears not to believe the hype.

China home prices continue to slide...
China Home Price Slump Sends Iron Ore Plunging To 2009 Lows (-50% In 2014)

With 69 of 70 cities seeing falling prices...
China Home Price Slump Sends Iron Ore Plunging To 2009 Lows (-50% In 2014)
Source: @M_McDonough

And that led to more weakness in Iron Ore (and copper) prices...
China Home Price Slump Sends Iron Ore Plunging To 2009 Lows (-50% In 2014)

which is ironic because the Chinese homebuilders went crazy in October increasing new home starts by 38.6% YoY in October...!!
China Home Price Slump Sends Iron Ore Plunging To 2009 Lows (-50% In 2014)

That will not end well.

Thursday, November 6, 2014

Global Commodity Prices Are Collapsing At The Fastest Pace Since Lehman

Nothing to see here, move along...
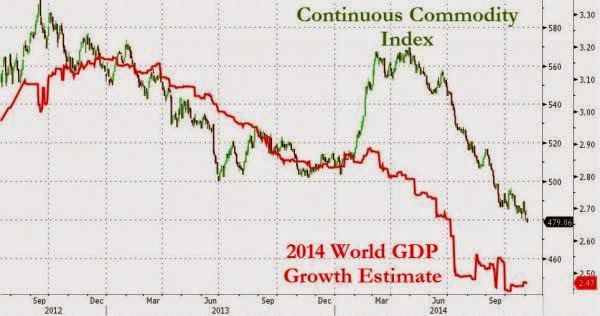
We are sure it's nothing to worry about, and in now way indicative of any global aggregate economic weakness, but global commodity prices (that would be the 'stuff' that is used to make the 'stuff' we all buy every day) are collapsing at the fastest rate since Lehman...
Global Commodity Prices Are Collapsing At The Fastest Pace Since Lehman

Of course, it's all about over-supply, not under-demand... just like the Baltic Dry was not low because of shitty trade volumes but because of too many ships... but it's just the other side of an uncomfortably real mal-investment-driven fiasco...
As the chart below shows... maybe it is the economy stupid and with US GDP expectations being ratcheted down after construction spending and trade deficit data, maybe the US is not decoupling after all.
Global Commodity Prices Are Collapsing At The Fastest Pace Since Lehman

But is merely 'lagging' as it always does...
Charts: Bloomberg


Saturday, October 25, 2014

Worldwide nonferrous metals exploration budgets down 25% in 2014

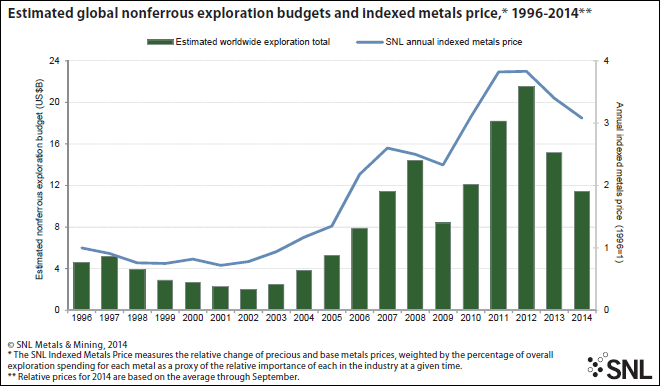
According to data compiled for the forthcoming 25th edition of SNL Metals & Mining's "Corporate Exploration Strategies" study, the estimated worldwide total budget for nonferrous metals exploration dropped to US$11.36 billion in 2014 from US$15.19 billion in 2013 — a 25% decrease
.
SNL Metals & Mining's 2014 exploration data and analysis are based on information collected from almost 3,500 mining and exploration companies worldwide, of which almost 2,000 had exploration budgets for 2014. The companies, each budgeting at least US$100,000, budgeted a total of US$10.74 billion for nonferrous exploration in 2014. Including our estimates for budgets we could not obtain, the 2014 worldwide exploration budget comes to US$11.36 billion. Nonferrous exploration refers to expenditures related to precious and base metals, diamonds, uranium and some industrial minerals; it specifically excludes iron ore, aluminum, coal, and oil and gas.

Higher operating and capital costs, lower ore grades, uncertain demand for commodities and investor discontent have required major companies to focus on a return to healthy margins after years of growth-oriented spending. To that end, the majors have been divesting noncore assets and cutting back on capital project and exploration spending, which has led to an unsurprising 25% drop in the majors' exploration budget total in 2014. The juniors continue to battle lackluster investor interest, which has forced the group to rein in spending in order to conserve funds. The juniors' total exploration budget fell 29% year over year in 2014 after falling 39% in 2013, dropping their share of the overall budget total to 32% from a high of 55% in 2007.

Worldwide nonferrous metals exploration budgets down 25% in 2014
Exploration allocations for all targets except platinum group metals decreased in 2014. Although gold remains the most attractive target, gold budgets declined for the second consecutive year — dropping 31% to US$4.57 billion — to account for the metal's lowest share of worldwide exploration budgets since 2009 at just 43%. Despite base metals budgets falling by US$1 billion, their collective share of total budgets increased 2% to reach the highest level since 2008. Base metals and gold allocations have a consistently inverse relationship in terms of their shares of overall budgets.

Despite lower allocations for most countries, companies continue to explore across the globe; exploration is planned for 124 countries in 2014, down from 127 in 2013. The share of budgets allocated to mature mining regions such as Canada and the United States fell in 2014; Canada's total budget was down 22% year on year due to weakness in the country's junior sector, while the United States' total declined 27% as many major copper producers scaled back exploration programs. Canada and Australia remained the top countries overall, with the United States, Mexico, and Chile rounding out the top five. Although Latin America's 26% year-over-year decline is relatively on par with the overall decrease in exploration budgets in 2014, two of the top exploration destinations within the region, Argentina and Colombia, saw declines of 46% and 42% respectively due to local opposition to mining and political instability. West Africa declined more than the African region — 38% compared with 28% — due primarily to the faltering gold price and regional insecurity; the Ebola crisis will almost certainly result in even further cutbacks to West Africa exploration programs in the second half of 2014.

For the first time since SNL Metals & Mining began the series of "Corporate Exploration Strategies" studies, the proportion of overall exploration budgets dedicated to mine site work surpassed the budget for grassroots activity. Since 2012, producers have been increasingly emphasizing brownfields programs as a less capital-intensive and less risky means of replacing and adding reserves. The proportion of the annual total allocated to grassroots exploration hit a record low this year, as many junior companies, which have historically accounted for the largest portion of grassroots spending, sharply curtailed programs to conserve cash as the exploration sector struggles to rebound from a two-year downward trend. This reduced focus on early stage and generative work has led to concern that many companies, and perhaps the industry in general, are sacrificing long-term project pipelines in favor of consolidation and maximizing returns.

Monday, October 20, 2014

The Commodities Trading Cheat-Sheet

With commodity prices tumbling to 2009 lows, comprehending between the differing risks to Soybeans and Silver or Copper and Cocoa is crucial. Deutsche Bank has created just that 'cheat-sheet' - just how vulnerable is Gold to Ebola? or Silver to China growth?

Bloomberg's Commodity index is at 2009 lows...
The Commodities Trading Cheat-Sheet

So here's how to differentiate the commodity complex's risks...
The Commodities Trading Cheat-Sheet

Charts: Bloomberg and Deutsche Bank

Monday, October 6, 2014

‘We may be at the start of a commodity uptrend’

When companies do well, they buy natural resources, says the Global Head of Commodities at S&P Dow Jones Indices
Jodie Gunzberg is responsible for managing S&P’s commodity indices, including the bellwether S&P GSCI, regarded as the leading measure of commodity price movements globally. In an interaction withThe Hindu BusinessLine, she talks about why, after a six year lull, commodities may be back in action.
What has been the trend in global commodity markets in the last few years?
In the past few years, supply has outweighed demand, especially from 2008. When the global financial crisis hit, demand dropped off, so supply slowed to let the excess inventories draw down.
During this time, commodity performance was relatively weak. Finally, in 2013, commodities started to see shortages again. That continued through the second quarter of 2014 and performance made a comeback. However, since July, a combination of perfect weather for grains and fewer oil supply disruptions have built up inventories in several major commodities.
Precious metals have been down on decent retail sales in the US, but may strengthen, depending on Russia-Ukraine tensions. Also, gold, after having dropped significantly in the last one month, seems attractive to China for the mid-autumn festival and to India ahead of the Dhanteras and Diwali festivals in addition to the wedding season. Industrial metals is the only sector that has held strong, mainly from supply constraints and strategic stockpiles. Overall, the strengthening dollar has been a headwind for commodities, though much will depend on weather and supply disruptions, especially for commodities with sensitive inventories.
‘We may be at the start of a commodity uptrend’
Do you think commodities will under-perform stock markets in the next one year?
This depends on a number of influences. If inflation materialises, interest rates rise and shortages persist, it is likely commodities will do relatively well. It also depends on where the commodity/equity cycle is and when the turning point may happen.
We have now seen six years straight of equity out-performance. As companies have raised capital, they may buy more natural resources to make their output grow further. This may increase demand for commodities and may be the beginning of the mid-cycle. Equities have historically led the cycle.
The economic revival in the US and Europe should help commodity prices revive, isn’t that so?
Stronger demand may help commodity prices, but again, there are other factors such as the strength of the dollar. Supply shocks also matter and when inventories are low, that may not only spike commodity prices but also drive down correlations down between commodities and other asset classes.
Will oil prices continue to fall?
Many factors may determine the future price of oil. Currently, oil is sensitive to slowing Chinese demand growth and euro zone manufacturing growth that may be further diminished by sanctions against Russia. Also, concerns have eased over supply disruptions from Libya and Iraq.
After rallying in the first few months of 2014, gold is now moving down. Where will prices go from here?
Gold historically acts like a combination of a commodity and a currency. Gold has suffered from the economic revival, strong stock market and stronger dollar.
Last time gold dropped as much in a year (in 1981) as it did in 2013, it took 25 years to recover.
What should a commodity investor watch out for?
There are two major opportunities to capture returns in commodities — cyclical opportunities and systematic opportunities. Trend-following systems can capture cyclical opportunities because only price can respond to supply and demand balance.
This is because commodities, in the short run, cannot be drilled and mined, causing relatively slow cycles of inventory building.
So when there is a supply/usage imbalance in a commodity market, its price trend may be persistent, which may be captured by trend-following programmes.
However, currently commodities are hovering at near equilibrium. Short-term disruptions can swing the pendulum quickly, leading to opportunities to bet on mean-reversion.
It is debatable whether the shortages that appeared in 2013 and the first half of 2014 are gone for good.  The inventory build-up may be temporary based on weather and geopolitics.

However, one must keep focus on longer-term factors such as the strength of the dollar, which is historically inverse to commodity prices, rising inflation, rising interest rates and demand forces coming from China and other parts of the world.

Thursday, October 2, 2014

The Best And Worst Performing Assets In September, Q3 And 2014 YTD

When it comes to asset returns, September, and the entire third quarter for that matter, belonged to Asia.
Technically, it belonged to Asian central banks, because while the rest of the world generated weak returns in the past month, the two best performing asset classes were the Nikkei (+5.4%) and the Shanghai Composite (+6.8%), both of which soared on speculation that the local central banks would promptly conduct even more monetary easing. This was most obvious in the Nikkei where while in local currency terms the market is soaring, as is the one in Argentina and Venezuela, denominated in USD, the Nikkei is still down in 2014, performing worse than gold.
In USD terms however, those long the Nikkei have lost in purchasing power everything they have gained in capital appreciation.
On the other side, however, the biggest losers so far at least are clear: Corn, Silver, and Wheat. In terms of fiat-denominated assets, the Russian stock market is the worst performing in 2014, with Greece breathing down its next.
Some more color from DB:
September turned out to be a fairly weak month for most asset classes even if equities and fixed income are still generally in positive territory for the year. Indeed screening our usual monthly performance review charts, the Nikkei (+5.4%) and the Shanghai Composite (+6.8%) were the only standout performers in September. Japanese equities benefitted from a weaker JPY with the Dollar enjoying its best quarterly performance since Q2 2008. The strength.

Staying on equities, the S&P 500 was down over 1% in September despite a landmark 2,000 crossing during the month. Across DM equities, the S&P 500 (+8.3%) is still a relative outperformer against Stoxx 600 (+7.6%) and the FTSE 100 (+1.2%). Turning to EM, the MSCI EM index was down -7.4% during the month. Greece and Bovespa were the other key underperformers in equities. The former was impacted by renewed political uncertainties around Greece’s aid package plans whilst the latter saw a completed unwind of its outperformance in August as election polls suggested diminished hopes of leadership change in the country. Elsewhere the Heng Seng was down 6.9% in September to post its worst month since May 2012 as sell flows  intensified on the back of the pro-democracy protests at the end of the month.

Fixed income didn’t quite benefit from the broader risk off with Treasuries and Bunds down -0.6% and -0.2% on the month. Credit markets also had a bad month from a total return standpoint with HY underperforming IG across the board. Following a brief reprieve in August, US HY actually lost more in September (-2.6%) than it did in July (-1.7%) and went on to post its worst quarter since Q3 2011 when the USA was stripped off  its AAA rating and European Sovereign were struggling. September was second worst month for EM bonds this year largely led by weakness in Latam whilst Asia outperformed on a relative basis. YTD Asian bonds have outperformed Latam and EEMEA bonds by around 400bps and 800bps respectively.
And visually, September:
The Best And Worst Performing Assets In September, Q3 And 2014 YTD
Third Quarter
The Best And Worst Performing Assets In September, Q3 And 2014 YTD

2014 YTD:
The Best And Worst Performing Assets In September, Q3 And 2014 YTD

Saturday, September 20, 2014

Did The Bottom Just Fall Out Of Commodities?

Global growth expectations... we have a problem. With all eyes focused on BABA, Treasury yields, and Russell 2000 death-crosses. 
The old equally-weighted CRB commodity index has broken down through support to 4-year lows this morning...

Did The Bottom Just Fall Out Of Commodities?

Commodities have slipped notably since confirming their own death cross in August.

Sunday, September 7, 2014

INFOGRAPHIC: A forecast of when we'll run out of each metal (Commodities)

Here is one interpretation of when we’ll run out of each metal or energy source. While the technicalities of some of this information can be debated, I think the general theme runs the same. There is a limited supply of these commodities – and if there are no discoveries, no price changes, and no changes in consumption, we are running out relatively soon. In my opinion, there are two caveats that are always worth considering when looking at something like this.
1. “Reserves” are an engineering number that are based on economic viability. Technically speaking, there are small concentrations of gold everywhere. It is just not usually viable to mine 0.1 g/t gold. When we will “run out” of each mineral in this chart is based on current reserves and prices. If the gold price doubles, then suddenly it is economic to mine more.
2. This chart is a reminder that something has to give. Either prices are going to have to go up, or new amazing discoveries have to be made to keep prices down. It’s basic economics, and either way it seems that there are many opportunities in the mining industry for investors and speculators on both fronts.
A Forecast Of When We'll Run Out of Each Metal

Wednesday, September 3, 2014

And The Best Performing Asset In August Was...

August is the month in which the third try for a global economic recovery officially snapped, with first China, then Europe and finally Latin America succumbing to pre-recession forces and/or outright contraction. Which, in the New Normal, is great news as it means more hopes for even greater imminent central bank easing and "stimulus" if only for the wealthiest (and also please ignore the fact that 6 years of more of the same has not worked, this time will be different). Which explains why August, otherwise the sleepiest month of the year, proved to be fairly strong with both equities and bonds moving higher in tandem.
In fact, the situation in Europe is so dire, that European government bonds yields reached/retested their record multi-century all time lows. As Deutsche Bank summarizes, the 10yr government bond yields for Germany, France, Italy, Spain, and Switzerland declined by 27bp, 28bp, 26bp, 28bp and 11bp in August to 0.89%, 1.25%, 2.44%, 2.23% and 0.44% respectively. From a total returns perspective, a 2% gain in August was the best monthly performance for Bunds and OATs since January which brings their YTD gains to around 8-9%. Not bad in the context of a 7% and 4% YTD gains in Stoxx 600 and the FTSE 100. Italian and Spanish government bonds are still ahead though on a YTD basis with total returns to date at around 12-13%. Staying in rates, US Treasuries were somewhat of a laggard relative to its European peers in August with a monthly return of around 1.2%. Nonetheless, it was still the biggest gain for Treasuries since January and the outperformance in long bonds has also driven the 10s/30s curve to its flattest since June 2009. The search for yield has also benefited Credit on both sides of the Atlantic. Total returns were positive across the main European, US and Sterling credit benchmarks although the highlight was a rebound in US HY. The asset class gained +1.8% in August after having lost 1.7% in July as outflows steadied and reversed as the month progressed.
DM equities were generally higher but the highlight goes to the S&P 500 (+4%) after having made its first crossing of the 2,000 mark in August. Performance was more mixed in Europe but generally still moderately positive. EM equities had another decent month with the MSCI EM index enjoying a 2% plus return for the fourth consecutive month. Commodities were the key losers in August. The CRB index (-0.6%) finished lower for its second consecutive month. Copper, WTI, Brent, Sugar, Silver were all between 2%-6% lower. The fact that Oil prices have now gone officially negative for the first time in 2014 despite the ongoing geopolitical tension is perhaps telling us something?
But nowhere is the humor of central planning better exhibited than in Brazil was a clear outperformer with the BOVESPA (+10%) posting its best monthly performance since January 2012. Why? Because Brazil just entered a recession. Perhaps the reason why the joke that global thermonuclear war will send futures limit up is funny, is because it's true...
August return by asset class:
And The Best Performing Asset In August Was...

And YTD:
And The Best Performing Asset In August Was...
Source: Deutsche Bank

Friday, August 22, 2014

Correlation between Indian and global comexes

Correlation between Indian and global comexes
How global trends influence domestic futures & local scenarios reflect in international markets
As India opened up to global trade in the last two decades amid an increasingly inter-dependent world, global factors and global prices have had a strong effect on Indian commodity prices. India is a major importer of precious metals, energy, base metals. India’s dependence on imports results in Indian commodity prices at a par with global commodity rates with the rupee and import duty changes causing divergence between local and global prices. India has emerged as a major exporter of wheat and rice in the last few years leading to influence of global grain prices and USD-INR changes on Indian grain prices.
Commodity futures traded on Indian exchanges, which are international in nature, are impacted by price changes in key overseas futures contracts. Futures contract of commodities which have little footprint outside India viz. spices, pulses, etc. are mainly driven by domestic supply and demand factors along with local speculative activities. However, energy, precious and base metals have strong correlation with overseas futures. Even soyabean, cotton, palm oil, sugar, etc. are strongly influenced by global futures price movements.
Currency volatility
Futures of metals and energy commodities viz crude oil, gold, silver, copper, zinc which are actively traded on the domestic bourses show strong correlation with their corresponding global benchmark futures contracts. MCX crude oil futures have a strong correlation of 98.70 per cent with Nymex crude oil futures, with it seldom falling below 97 per cent. Changes in correlation are due to USD-INR volatility. A sharp weakness in the rupee, similar to events in 2013, leads to higher domestic prices even as global prices could be stagnant. Very high correlation values are also seen in MCX gold and MCX silver futures with respect to their benchmark Comex contracts. The 100 days correlation of MCX gold futures with Comex gold futures is near 70 per cent.
For a considerable time in the past, the correlation was high as 99 per cent. However, the volatility in the rupee along with distortion due to increase in import duty of gold and silver contributed to lower correlation in recent times. Relatively newer contracts – gold hedge and silver hedge futures contracts by NCDEX – provide a better alternative to Indian traders who want better correlation with global contracts as prices of these hedge contracts are exclusive of Customs duty, local sales tax/VAT/Octroi and any other charges or levies. Thus these contracts will not be affected by changes in Indian import duty or other duties.
Market hours
MCX copper futures have near 98.20 per cent correlation with LME copper prices. Indian metals and energy futures also have a higher intraday correlation with global futures since Indian commodity markets are active till 11:30 pm at night, coinciding with active overseas market hours. MCX zinc, aluminium, lead and nickel futures contracts also show a very strong correlation with the corresponding benchmark contracts on the LME.
Futures contract in agricultural commodities also exhibit better correlation with international benchmark contracts; however, it is not as strong as it is with metals and energy commodities. NCDEX soyabean futures currently have 100-day correlation at 91.60 per cent which is at the high end of the range.
Deviation in prices
In the last 10 years, this value has oscillated between the range of -40 and 96 per cent. Since soyabeans in India are not freely traded due to high import duty structure, domestic prices are not directly influenced by the global benchmark CBOT soyabean prices. However, India is a large importer of soya oil and is also an important Asian exporter of soyameal. Global changes in soya oil and soyameal prices influence Indian soya oil and meal prices which, in turn, have an effect over domestic prices. NCDEX soya oil futures have 100-day correlation of 89.30 per cent. Similarly, 100-day correlation between MCX crude palm oil futures and BMD crude palm oil futures are at 94.30 per cent indicating very strong correlation. Here too the volatility in the rupee, import duty changes along with domestic supply and demand scenario play a role in deviation between Indian and overseas prices.
Indian wheat futures, currently, have a poor 100-day correlation at -14.60 per cent with CME wheat futures due to rupee volatility, export permits/demand, local supply and demand factors, MSP, etc. This value has been as high as 85 per cent in 2012. Similarly, Indian corn futures currently have a poor 100 day correlation at -24.60 per cent with CBOT corn futures. However, the broad trend in international prices does have an impact on prices of domestic agriculture commodities.
India is the second largest cotton producer and also the second largest cotton exporter in the world. Changes in the in Indian cotton demand and supply scenario affects international prices and vice-versa. The 100-day correlation between ICE cotton and MCX cotton is at 87.80 per cent.

Monday, August 18, 2014

Speculators boost bullish bets in gold, cut silver and copper longs - CFTC

Hedge funds and money managers boosted their bullish bets on gold futures and options for the first time in three weeks, as the metal's prices climbed on rising geopolitical tensions, the Commodity Futures Trading Commission said on Friday.
The group, also known as Managed Money, slashed net-long positions in silver and copper markets in CFTC's latest Commitments of Traders report.
Iraq's worsening security conditions due to an Islamist insurgency and increasing violence in Gaza triggered safe-haven demand, sending bullion prices nearly 2 percent higher in the week to Aug. 12, the period covered by the CFTC data.
Speculators increased their net long position in gold by 29,598 contracts to 133,708 lots, the CFTC data showed.
The group lowered net long positions in silver by 5,560 lots to 23,506 contracts.
Speculators boost bullish bets in gold, cut silver and copper longs - CFTCSpeculators also cut 15,233 bullish bets in copper to lower the market's net longs to 19,096 lots, their fourth consecutive decrease.
In addition, the group increased bets on platinum by 1,243 contracts to a net long of 39,080, and added palladium longs by 1,351 to 18,158.
Interactive graphic: http://r.reuters.com/buv87r

Friday, August 15, 2014

Copper & Crude Are Getting Crushed

Despite global geopolitical crises exploding among the world's biggest producers of oil, WTI (and Brent) crude oil prices have tumbled to 5-month lows (WTI At $96). Despite the exuberant PMIs in China, Copper and Iron ore prices are collapsing (2-month lows). One can't help but wonder what global 'economic growth' must really be like if 'demand' for all these crucial growthy commodities looks so weak?

Copper and crude have been smacked 2 days running starting at 8amET...
Copper & Crude Are Getting Crushed

Pushing them to multi-month lows...
Copper & Crude Are Getting Crushed

Notably - the initial spot surge in commodities post-Qingdao ponzi debacle has now given way to broad-based weakness...
Copper & Crude Are Getting Crushed

Thursday, August 7, 2014

Is August a better month for Commodities?

 Is August a better month for Commodities?
Commodities collectively had their worst monthly performance in more than two years during July and the group could push somewhat lower in August. 
According to INTL FCStone, August as usually a messy month for equities leading to an even sloppier September. 

“If we are correct on our view on U.S. equities, we could see spillover selling hitting precious metals, oil, and some of the base metals, at least initially, before the various asset classes start to decouple,” said INTL FCStone in its monthly outlook. 

INTL FCStone's Precious Metals and Energy Outlook for August
Gold is already struggling under the prospect of decent growth in both China and the US lackluster investment demand, poor technicals and the likelihood of higher U.S. rates going into 2015.

Platinum and palladium could also ease a bit this month, although their fundamentals look much better than gold. Oil markets are oversupplied and with various geopolitical hotspots not imperiling oil flows, at least for the moment, we think the path of least resistance is lower still. 

INTL FCStone believes that lower trading ranges are also in store for energy products, as well as for natural gas. 

INTL FCStone's Base Metals Outlook for August
Base metals have regained some lost ground this week, but INTL FCStone thinks that some in the group are overextended based on fundamentals. 
Zinc, in particular, is now at a three-year high and INTL FCStone believes prices have more than discounted the complex’s improving supply/demand profile, while not adequately discounting the very real possibility of a further contraction in the Chinese real estate market.

However, INTL FCStone said lead has not participated fully in the recent base metals advance and we still like its story heading into the second half of the year. 

The firm describes itself as neutral on copper at current prices, looking for a sideways range this month.