Showing posts with label INDEX. Show all posts

Friday, February 19, 2016

Visualizing The World's Stock Exchanges

There are 60 major stock exchanges throughout the world, and their range of sizes is quite surprising.
As Visual Capitalist's Jeff Desjardin notes, at the high end of the spectrum is the mighty NYSE,representing $18.5 trillion in market capitalization, or about 27% of the total market for global equities.
At the lower end? Stock exchanges on the tiny islands of Malta, Cyprus, and Bermuda all range from just $1 billion to $4 billion in value. Even added together, these three exchanges make up just 0.01% of total market capitalization.

Visualizing The World's Stock Exchanges
Courtesy of: The Money Project

The Trillion Dollar Club
There are 16 exchanges that are a part of the “$1 Trillion Dollar Club” with more than $1 trillion in market capitalization. This elite group, with familiar names such as the NYSE, Nasdaq, LSE, Deutsche Borse, TMX Group, and Japan Exchange Group, comprise 87% of the world’s total value of equities.
Added together, the 44 names outside of this aforementioned group combine for just $9 trillion, or 13%, of the world’s total market capitalization.
Northern Dominance
From a geographical perspective, it is the Northern Hemisphere that is dominant. North America and Europe both hold 40.6% and 19.5% respectively of the world’s markets, and the vast majority of Asia’s 33.3% lies north of the equator in places like Shenzhen, Hong Kong, Tokyo, and Shanghai.
Notable exchanges that are south of the equator include the Australian Securities Exchange, the Indonesia Stock Exchange, the Johannesburg Stock Exchange and the Brazilian BM&F Bovespa.

S&P and Distressed Debt Issuers

It's definitely different this time...
The 2008 analog lines the current trajectory up with August 2008 right after Treasury Secretary Paulson told the world reassuringly that:
"Our economy has got very strong long-term fundamentals. And you know, your policy-makers and regulators here - we're very vigilant."
And we all know what happened next...
S&P and Distressed Debt Issuers

Could never happen again?
Yeah you're probably right...
S&P and Distressed Debt Issuers

If "everything's fixed," then why is the number of distressed debt issuers still the highest "since Lehman."
S&P and Distressed Debt Issuers
And the answer is not - it's just energy and it's different this time.

Saturday, February 6, 2016

"A Key Technical Indicator Just Rang The Bell On The Cyclical Bull Market"

While the primary topic of Albert Edwards' most recent note is the question how long China can sustain its FX intervention before tapping out and letting the hedge funds win with their short Yuan bets once total reserves drop below the critical redline of $2.7 trillion (the answer incidentally is between 5 months and 10 months assuming monthly reserve burn rates of $130BN to $60BN), we will skip that part as we have discussed it extensively in the past, and instead will fast forward to some chart porn by the SocGenarian.
Here is Albert Edwards showing that the S&P had breached key moving averages normally seen at the start of a bear market.
Back in the mid-1990s I spent three memorable years working at Bank America Investment Management, among some of the industry’s finest. Having previously spent three years as an economist at the Bank of England, I was new to markets and I let my economic enthusiasm often get the better of me when making recommendations to fund managers.

I remember the head of fixed income explaining to me it was far better not to try and pick market tops or bottoms but to wait and observe the market turn, making the trade late rather than prematurely trying to pick the bottom or top.

So the chart below is notable, showing that key 200d and 320d moving averages for the S&P have just been breached to the downsideIf one is looking for key technical indicators to ring the bell on the cyclical bull market- maybe it has just rung loud and clear.

A renminbi devaluation will only sever an already badly frayed safety rope.

"A Key Technical Indicator Just Rang The Bell On The Cyclical Bull Market"

Saturday, January 9, 2016

Market Massacre: Worst Ever First Week Of Trading

This was the worst first week of the year for US equities... ever!
Dow... (even worse than 2008)
Market Massacre: Worst Ever First Week Of Trading

S&P...
Market Massacre: Worst Ever First Week Of Trading

Europe was a disaster...
Market Massacre: Worst Ever First Week Of Trading

And epic for China...
Market Massacre: Worst Ever First Week Of Trading

And while only Trannies are in a bear market (down 20%) in the US, these 7 developed world markets are already there...(h/t SocGen's Andrew Laphthorne)
Market Massacre: Worst Ever First Week Of Trading
Commodities were very mixed this week...
Market Massacre: Worst Ever First Week Of Trading

Gold rallied 4% this week - its best 'first week of the year' since 2008... (best week in 5 months) - breaking 2 key technical levels...
Market Massacre: Worst Ever First Week Of Trading

Crude down 5 days in a row touching a $32 handle at the lows... biggest weekly drop since Nov 2014
Market Massacre: Worst Ever First Week Of Trading

Tuesday, January 5, 2016

The Best And Worst Performing Assets Of 2015

Late in 2015, Germany's Handelsblatt reported, erroneously, that Venezuela was the best performing asset class of 2015.
The Best And Worst Performing Assets Of 2015

It wasn't. The reason this was in error is because if one adjusts the returns into the real currency exchange rate, one which reflects the true implosion of the economy, instead of the government "mandated" one, the result is very different, one which shows that contrary to popular wisdom, during hyperinflation stocks are not a good store of value.
The Best And Worst Performing Assets Of 2015

So what were the real best and worst performing assets of 2015? Here, with the full breakdown in both local currency and USD-redenominated terms, is DB's Jim Reid.
* * *
With markets wrapped up for 2015 now, reviewing the performance of asset classes last year shows that it was one where negative asset class returns were aplenty, while those finishing in positive territory were few and far between.
Indeed, of the 42 assets we monitor in Figure 5, just 9 finished with a positive return in Dollar-adjusted terms over the full year. Of these, the big winner was the Nikkei (+10.4%) - boosted by the accommodative BoJ and relatively stable Yen. In the periphery we saw both Portuguese (+6.5%) and Italian (+3.9%) equity markets also close higher, while in China the Shanghai Comp (+6.2%) finished up for the year but not without some huge volatility over the 12-months and of course ending well off the highs it posted back in June.
The S&P 500 (+1.4%) also closed just about in positive territory for the year on a total return basis although that performance was the worst for the index since 2008 as energy stocks clearly weighed for much of the year, while there was a similar return for US Treasuries (+0.8%).
At the other end of the scale there were some notable losers for us to pick out. In particular it was Oil which stole the limelight with huge falls for both Brent (-44.1%) and WTI (-30.5%) while Copper (-24.4%), Wheat (-20.3%), Silver (-11.7%) and Gold (-10.4%) were also hard hit. Both political and economic fragility saw Brazil (-42.0%) and Greece (-30.3%) fall the most in the equity space while EM equity markets finished with a broad -14.8% decline.
US Dollar strength was a big theme for 2015 as evidenced by the lack of winners above with the Dollar index returning a hefty +9.3% for the full year. This meant there were decent falls for the Euro (-10.3%), Aussie Dollar (-10.7%) and Canadian Dollar (-16.1%).
In local currency terms Russian equities (+32.3%) came out on top along with some of the peripheral markets. In the credit space it was the divergence between European and US credit which was most notable. Reflecting the higher exposure to energy credits, US HY closed with a -5.0% loss for the full year, while US IG was down a more modest -0.4%. In Europe we saw EUR HY finish +0.5% and EUR Sub Fins +1.4%, although EUR IG Corp was down -0.7%. Again converting this into US Dollar terms results in any gains for European credit being wiped out and in turn underperforming US credit for the full year.
The Best And Worst Performing Assets Of 2015

Monday, November 2, 2015

S&P 500 -The Scariest Chart, "Most Overbought" In 11 Months.

What would Halloween be without a scary chart of The Stock Market That Cannot Die? We know the stock market cannot die because we’re constantly told it’s immortal:
S&P 500 -The Scariest Chart,  "Most Overbought" In 11 Months.
You know the drill: the Federal Reserve will never let the market fall, never, never, never: it will continue to loft higher for all time, in immortal glory.
Like a blood-sucking vampire, the market is parasitically feeding off the real economy. As the host weakens, the parasite increases its control. Now the market is telling the real economy: if I die, you die, too.
The entire Status Quo is now utterly dependent on a rising stock market: not just for the illusion of the wealth effect, but for tax revenues, pension fund stability, and the fantasy that a rising market is a substitute for a healthy economy.
It’s terribly frightening to be in thrall to a parasite that will bleed its host dry to maintain itself. But that’s not the scariest possibility.
The scariest possibility is that the stock market will fall despite all the promises that its advance is immortal.
If this were to happen, all those “safe” index funds would implode along with the broad market.

 "Most Overbought" In 11 Months

S&P 500 -The Scariest Chart,  "Most Overbought" In 11 Months.
The last time S&P 500 rallied at such a pace (from an extreme of oversoldness) and reached such an extreme level of overboughtnessthings went south rather quickly...

Friday, October 2, 2015

DAX Reverses Month-End Ramp, Suffers Worst Start-To-Q4 Since 2009

Germany's DAX has given back all of yesterday's exuberant month-end gains and more to suffer the worst start to Q4 since 2009 (and actually worse than 2007 and 2008)...
Early hope collapsed into reality...

DAX Reverses Month-End Ramp, Suffers Worst Start-To-Q4 Since 2009

Copper, Crude, Credit Crumble As Stocks, Bond Yields Tumble

Copper, Crude, Credit Crumble As Stocks, Bond Yields Tumble

Sunday, August 23, 2015

Carnage: Worst Week For Stocks In 4 Years, VIX Soars Most Ever


Carnage: Worst Week For Stocks In 4 Years, VIX Soars Most Ever
  • China's worst week since July - closes at 5 month lows
  • Global Stocks' worst week since May 2012
  • US Stocks' worst week in 4 years
  • VIX's biggest weekly rise ever
  • Crude's longest losing streak in 29 years
  • Gold's best week since January
  • 5Y TSY Yield's biggest absolute drop in 2 years
*  *  *
Did you get message Fed?

THE CLEAR MESSAGE FROM THE MARKETS IS - HIKE RATES AND YOU'RE DONE, GIVE US QE4 OR IT'S ALL OVER!!!
So let's start with stocks...
Bloodbathery... This was the worst week for global stocks (MSCI World) since May 2012

And the worst week for US equities since Nov 2011...

Futures show the pain started with China PMI, then dumped as Europe collapsed,  then there was no help from the machines as gamma was so imbalanced...

Of course we saw The BoJ in da house to help squeeze stocks with some USDJPY crushing...but that only worked for the small caps (easiest to squeeze)... and then it all collapsed...

Dow enters correction... this was the 9th largest point drop in the history of The Dow...

And The VIX ETF saw its biggest 2-day rise since 2011 (no wonder with 61.7mm shares short against just 60.6mm outstanding)

and before we leave stock-land, her is perhaps the 'spookiest' chart... a Fibonnaci 61.8% extension of the 2007 high to 2009 lows 'nails the top' for now... (h/t @allstarcharts )

FX was a disaster...

Monday, June 8, 2015

S&P Go Short With SL of 2110 For Target Of 2065/2050

S&P Go Short With SL of 2110 For Target Of 2065/2050
S&P One Can Go Short With SL of 2110 For Target Of 2065/2050 n Then a Minor Correction.

Go Short for target of 2023,1992,1968, 1947..... 

Trendline Support @ 2081.

World’s 2nd Biggest Stock Breaks 28-Year Trendline

World’s 2nd Biggest Stock Breaks 28-Year Trendline
On March 24, we posted a rare piece on an individual stock. As we do not invest in individual stocks, they are typically not our focus. Therefore, it takes extraordinary circumstances to inspire a post on a single stock. That was the case with the March 24 post which noted the fact that Exxon Mobil (XOM), the world’s 2nd biggest stock, was testing a trendline that began back in 1987.
The origin of the trendline, based on a logarithmic scale of XOM, is the low point of the October 1987 crash. It then precisely connects the 1994 and 2010 lows. Interestingly, the stock stopped on a dime in March once it hit the vicinity of the post-1987 trendline. I say interestingly because, at the time, the stock appeared to be in no-man’s land. There were no obvious support or resistance levels in the vicinity. And yet, the stock stopped right on the trendline. It then proceeded to “walk up” the trendline for the next 18 days.
To those who dismiss the influence of technical analysis and charting techniques on the behavior of stocks as completely random, I can hardly think of a better example of counter-evidence than this. What are the odds that a stock “respecting”, or adhering to, a nearly 3 decade-old trendline is completely random – for 18 days? Furthermore, after bouncing off this trendline into May, XOM returned to it over the past few weeks. It spent 6 straight days sitting squarely (again) on the trendline…before breaking below it yesterday.
This breakdown marks the first day that Exxon Mobil has ever closed below this trendline. Now, assuming the stock’s behavior around the trendline is not completely random, and considering its capacity as the 2nd biggest stock in the equity market, the effect of this breakdown may be profound. Absent an immediate reversal back above the trendline, this loss of 28-year support would appear to open the door to more downside in the stock.
Sourced : By Dana Lyons, partner at Lyons Fund Management and founder of 401kPro.com

Wednesday, May 13, 2015

Chinese Stocks Overtake US As Most Actively Traded Futures Contract In The World

Having lost its mantle as largest economy in the world to China... and world's biggest oil importer (again to China), 'exceptional' USA appears to have just lost its Number 1 status in financial market depth to China also...

China's Financial Futures Exchange CSI-300 futures contract has now traded more on average than the massively liquid S&P 500 e-mini contract for the last month...
Chinese Stocks Overtake US As Most Actively Traded Futures Contract In The World

Of course, with millions of new retail trading accounts every week in China, we suspect this 'false dawn' of activity will not be quite as exuberant as we have seen for 6 months.

Thursday, January 22, 2015

S&P Surges As ECB's QE Leaked: Board Proposes €50 Billion In Bond Monetization Per Month

And so with less than 24 hours to go, the ECB has decided to leak its deliberations not only to Merkel and Hollande, but Dow Jones. To wit:
  • DJ: ECB EXEC BOARD'S QE PROPOSAL CALLS FOR ROUGHLY EUR50B IN BOND BUYS A MONTH -  SOURCES
  • ECB SAID TO PROPOSE QE OF 50 BILLION EUROS A MONTH THROUGH 2016
More as we see it, but if indeed this will be a program without risk-mutualization and conditional and limited burden-sharing, where the hope was that Draghi would "shock and awe" the world with the size of the bond purchasing program instead, €600 billion per year looks decidedly on the low side of any "surprise" announcement where the whisper number was for €1 trillion per year, and if indeed this is the final formulation may result in a substantial disappointment for stocks after the initial kneejerk reaction.
More from the WSJ which broke the news first, and was followed by Bloomberg and Reuters:
A proposal from the European Central Bank’s Frankfurt-based executive board calls for bond purchases of roughly €50 billion ($58 billion) per month that would last for a minimum of one year, according to people familiar with the matter.

The ECB’s executive board met Tuesday to decide on the proposal, which will form the basis of deliberations by the entire 25-member governing council on Thursday. The final number and details could change after the full board weighs in on the plan.

Still, the executive board’s proposal indicates that the ECB could move more aggressively than financial markets have expected. Forecasts among analysts have recently centered on a figure of around €500 billion or higher for a quantitative-easing program, but the executive board’s proposal suggests that bond purchases could amount to at least €600 billion.

An ECB spokesman declined to comment.
The knee-jerk reaction
S&P Surges As ECB's QE Leaked: Board Proposes €50 Billion In Bond Monetization Per Month

Thursday, January 15, 2015

S&P Down 5% From Highs, Dow Drops Almost 700 Points In 27 Hours

Things are escalating... Energy credit markets are pushing back towards record high spreads, copper is pushing back to the overnight lows and gold and silver are flat. US equity markets are the big movers withThe Dow down well over 300 points today (and nearly 700 points in the last 27 hours) and the S&P now down almost 5% from its highs. Treasury yields are 8-10bps lower on the day with 30Y yields at record lows and 10Y close.

S&P Down 5% From Highs, Dow Drops Almost 700 Points In 27 Hours
And the machines have a problem as JPY carry has decoupled from risk..
S&P Down 5% From Highs, Dow Drops Almost 700 Points In 27 Hours

Sunday, January 11, 2015

McHugh's Fearless Forecast for 2015: The Stock Market

As 2014 has closed, we want to present our view of where markets are headed in 2015 in a series of coming articles. Toward the end of this series, we will cover real estate and the economy, something slightly different than what we normally cover in our market reports, but something you may find quite interesting. Let's start by saying this: The year 2015 will be historic, with unusual events and high market volatility.


The Stock Market

We believe there will be at least one stock market crash in 2015 (a decline of 15 percent or greater, probably much greater than a 15 percent decline), with perhaps one or more mini-crashes (10 percent or more). We believe that the largest stock market decline in 2015 will be a crash, and that this crash will be underway (could last several weeks or months) within two weeks before or after September 14th, 2015. In other words, we see a stock market crash in the latter third of 2015. It could be huge, and could change the financial, political and regulatory landscape for years to come.
There is a convincing amount of evidence for this in this author's opinion. First is the multi-decade Jaws of Death pattern. It is finished or will be by the latter part of 2015, and warns of a mega-decline in the stock market, and an economic depression. I wrote a book about this (available at amazon.com) that many of you have read. The time will be at hand for the fulfillment of this stock market pattern in 2015.
The second convincing piece of evidence is a cycle pattern we follow that is rare and extremely correlative to stock market declines and economic downturns, pointing to a powerful economic and market collapse around September 14th, 2015. This cycle pattern was present for the 2008 and 2001 market plunges. It will be present again in 2015, the first time it has been evident since 2008. Then there is the Bradley model which is an astro cycle turn indicator which points toward a turn on September 23rd, 2015. We also have a Phi Mate Turn date scheduled for September 15th, 2015.
The multi-decade Jaws of Death stock market pattern is calling for an economic collapse and a market collapse. This is a Bear market for the ages coming, which we believe is already starting in stealth, masked by the artificial stock market rally whose main purpose has been to hide the truth about the underlying economy's collapse, including the unannounced disintegration of the middle class in America. Part and parcel with Bear markets are social strife issues. A negative psychological state of mankind.
One developing social strife that will have an enormous negative effect upon the stock market and the economy is the civil war that is breaking out in the United States between liberals and conservatives. It is time to call it what it is, a civil war. We see this in Washington's inability to govern and negotiate. We see this with our judicial systems' decision-making being driven ideologically, interpreting laws according to the justices' in power political views and personal values, with relativism and the ends justifies the means enforcement of American jurisprudence evident in many cases. The divide is wide and passions are at the brink of violence. Truth is being redefined as a point of view. The U.S. Constitution is being rewritten by court decisions and precedent cases that could be completely distant from what is written on that sacred piece of paper. The plain language of the U.S. Constitution is being ignored and replaced by pseudo intellectual hyperbole. This brewing civil war will be a contributing factor in the destruction of the economy and the stock market in 2015 and beyond, not to mention America's traditional values and way of life.McHugh's Fearless Forecast for 2015: The Stock Market

Do Stocks Always Fall After Crude Crashes?

Not always, but you will have to consider modern finance this time?
Modern finance
- Hedging protection
- Debt and derivatives blow ups associated with Oil companies.
- Percentage of economic growth lost verses benefit of cheaper oil.
As always timing is the factor, how much pain will be felt before we get the gain? The next 12 months will be rocky as the bad oil news flows through the market.
Chart: Crude oil on top, Dow Jones on the bottom.
Do Stocks Always Fall After Crude Crashes?
Source readtheticker.com

Tuesday, January 6, 2015

Jeff Gundlach: "If Oil Drops To $40 The Geopolitical Consequences Could Be Terrifying"

In a recent interview with FuW, DoubleLine's Jeff Gundlach explained his concerns about the oil market not being "unequivocally good" for everyone...
Question: The crash in the oil market is already causing jitters in the financial markets around the globe. What is your take on that?

Gundlach: Oil is incredibly important right now. If oil falls to around $40 a barrel then I think the yield on ten year treasury note is going to 1%. I hope it does not go to $40 because then something is very, very wrong with the world, not just the economy. The geopolitical consequences could be – to put it bluntly – terrifying.
What would that mean for stocks?
Jeff Gundlach: "If Oil Drops To $40 The Geopolitical Consequences Could Be Terrifying"
Gundlach is right historically...
Large and rapid rises and falls in the price of crude oil have correlated oddly strongly with major geopolitical and economic crisis across the globe. Whether driven by problems for oil exporters or oil importers, the 'difference this time' is that, thanks to central bank largesse, money flows faster than ever and everything is more tightly coupled with that flow.

Jeff Gundlach: "If Oil Drops To $40 The Geopolitical Consequences Could Be Terrifying"

So is the 45% YoY drop in oil prices about to 'cause' contagion risk concerns for the world?
*  * *
Of course Gundlach is not alone in this rational concern...
"In its November 14, 2014 Daily Observations ("The Implications of $75 Oil for the US Economy"), the highly respected hedge fund Bridgewater Associates, LP confirmed that lower oil prices will have a negative impact on the economy.

After an initial transitory positive impact on GDP, Bridgewater explains that lower oil investment and production will lead to a drag on real growth of 0.5% of GDP.

The firm noted that over the past few years, oil production and investment have been adding about 0.5% to nominal GDP growth but that if oil
levels out at $75 per barrel, this would shift to something like -0.7% over the next year,creating a material hit to income growth of 1-1.5%."

-- Mike Lewitt, The Credit Strategist
Source: Bloomberg

Friday, December 19, 2014

INFOGRAPHIC: what's ahead in 2015 – a survey of Wall Street's top analysts


What's Ahead in 2015: A Survey of Wall Street's Top Analysts

The folks on Wall Street remain optimistic that the party will keep on going. Hopefully nobody takes away the punch bowl.

Ten of the top analysts from the mainstays of Wall Street made predictions to Barron’s in an annual December survey. Their expectations for 2015? The S&P 500 will continue to soar (+10% was the mean prediction), the American economy will continue to gain traction (+3.0% GDP growth), and the top performing sectors will be Technology and Financials.

The worst performing sector will be Utilities, which has been the best performing sector of 2014 so far.

While we were not surprised that top analysts chose their own sector (Financials) as a top performer, we were surprised that not a single analyst expects a pullback in 2015. In the same sense, the vast range of GDP expectation variability is between the bounds of 2.8% and 3.5% growth.
Keep the Kool-Aid flowing, and drink it all up before it sits out in the sun too long.

For the full survey, check out Barron’s article here on it.

Wednesday, December 17, 2014

Total Chaos: Massive Market Moves Spark Selling-Panic Into Close

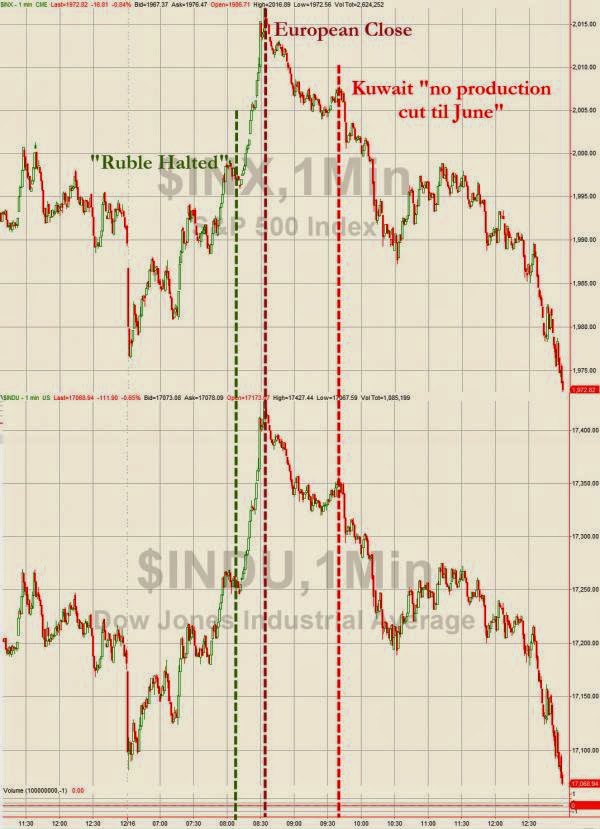
Perhaps this sums up the day for many FX, bond, equity, and oil traders today...

Incredible Volatility today - 100 point roundtrip in the S&P, and 800 points in the Dow - all driven by a halt in Ruble Trading, the European close, and Kuwait pissing on the US market's fireworks...


Total Chaos: Massive Market Moves Spark Selling-Panic Into Close
Close-up on S&P 500 e-minis... the machines ran all the stops everywhere today...
Total Chaos: Massive Market Moves Spark Selling-Panic Into Close

The Russian markets dominated headlines...
Total Chaos: Massive Market Moves Spark Selling-Panic Into Close

but the US credit markets were more worrisome as it appears the risk has finally started to appear in the investment-grade credit market.
High yield bond yields hit 2-year highs... and spreads to 18 month wides...
Total Chaos: Massive Market Moves Spark Selling-Panic Into Close

And Investment Grade credit has become infected...
Total Chaos: Massive Market Moves Spark Selling-Panic Into Close

Longer-term...
Total Chaos: Massive Market Moves Spark Selling-Panic Into Close
 Total Chaos: Massive Market Moves Spark Selling-Panic Into Close