Sunday, October 26, 2014

On The Coming Collapse Of Copper

18 months ago we first brought the world's attention to the end of what has now been exposed as among the largest ponzi schemes in history - the Chinese Commodity Financing Deals (CCFDs) - pointing out how this meant commodities like copper were likely to come under pressure as firms liquidate what minimal holdings they had (and sell out futures hedges) to manage the risk of unwinds in these quasi-collateralized deals. Since then, copper prices have indeed plunged, as has global growth expectations and global bond yields as a realization that 'demand' implied by previous prices was entirely artificial. Now, as Goldman notes, the real world is catching up (or down) to the reality of mal-investment and how copper is set to drop notably further...

On The Coming Collapse Of Copper

As Goldman Sach's Max Layton,
Metals and mining commodities – including the base and bulk commodities, steel and cement – are highly exposed to a slowdown in the Chinese property, with over 40% of Chinese demand for cement and copper in particular consumed in the construction sector. The recent slowdown in Chinese property sales, prices and early-cycle new starts has most impacted physical demand for (and sentiment towards) commodities exposed to the earlier stages of China’s construction cycle – steel and iron ore – which have underperformed commodities more exposed to latter stages of the construction cycle, such as copper.However, as the recent slowdown in new starts flows through to late-cycle, copper-intensive construction completions, we expect copper to come under further pressure.
On The Coming Collapse Of Copper
Understanding the construction cycle and commodity demand
The property development timeline for a typical Chinese building (such as an apartment building) from new start to property completion takes around 18 to 24 months. An “early-cycle” construction phase can be characterized as a period with strong new starts, relatively weak completions, and falling inventories (associated with higher sales). Conversely, “late-cycle” construction phases are typically associated with weak new starts, relatively strong completions, and rising/and or high property inventories (associated with weak sales). The intensity of basic material consumption varies significantly across these phases: consumption of steel and steel-making raw material (such as iron ore and coking coal) tends to be strongest in the earlier stages, while copper tends to be consumed in the later stages.
Specifically, as much as c.61% of Chinese and c.25% of global copper consumption is related to Chinese housing and property activity. Of the c.61% of Chinese consumption that may be related to property, up to c.45-50% is directly associated with project completion (plumbing, wiring for lighting, local power infrastructure, telecom, etc.), and c.12% is associated with the actual property sale, when the property is fitted with copper-intensive consumer appliances and/or tiling intensive in mineral sands. The strong link between completions and copper demand owes to the fact that internal and external copper wiring (for connection to the grid) tends to be installed around project completion. There is strong empirical evidence for the relationship between completions strength and copper prices: using completions as the primary indicator of China’s copper demand, together with ex-China demand data, explains the vast bulk of variation in copper prices over the past decade.
On The Coming Collapse Of Copper
Bad news for copper
In 2012/2013, the Chinese construction sector transitioned from an early-cycle construction phase to a late-cycle one, as completions surged following a wave of new stimulus-related construction post the Global Financial Crisis. Since then, the cycles have been relatively muted, with both new starts and completions growing sub-trend, for the most part. More specifically, the observed weak growth in new starts over the past two years has bearish medium-term implications for late-cycle copper-intensive construction completions. In our view, this weakness has not been priced in, as it has not flowed through to the physical market via higher inventories, and therefore supports our bearish copper view over the next year ($6,600/t and $6,200/t at 6- and 12-month horizons).
Double whammy (at the margin): commodity financing deals
In the past three years, China has increasingly employed complex commodity financing deals to import relatively low-cost US dollar funding, which in some cases has likely been used to fund property development. While the profitability of these financing deals has already fallen owing to lower Chinese interest rates, higher rates outside of China, and – in the case of copper – persistent LME backwardation, we expect a further gradual unwind in such deals over the course of 2015 as China opens up its capital account gradually over time. This broader reduction in financing deals, combined with an expected rise in US interest rates, could result in higher costs of funding for Chinese property developers, potentially further slowing property starts and property-related commodity consumption. At the same time, a further reduction in deals would reduce demand for copper imports into bonded warehouses in China (a key component of the financing transactions), potentially raising inventory visibility outside of China. This scenario would be a double whammy for copper, which is both highly exposed to the property sector and supported by low visible exchange stocks.

Saturday, October 25, 2014

Demand concerns put pressure on base metals

Demand concerns put pressure on base metals
The global base metals market is currently facing strong headwinds that impact price performance.

In 2012 and 2013, a combination of expanding liquidity, weakening dollar, China’s voracious appetite for consumption and slowly improving growth prospects helped a strong uptick in demand. 

Although selective, investor interest in base metals was healthy.
Things are different now. This year has not been a great one for metals market.

In recent months, some of the important drivers have reversed direction while new challenges have emerged. Shrinking liquidity following the US Fed’s tapering programme, a steadily firming dollar, slowing industrial production in some of the major economies and lower inflation expectations have combined to cap the upside and force market prices down.

Currently, macroeconomic risks are casting a shadow – concerns over growth being the most important.
There is apprehension of demand slowdown. As the mover and shaker of the world commodity market, China’s import and consumption of metals exert a profound impact.

With construction activity in the Asian major slowing, there are fresh concerns over metals’ demand growth.

Another reason is the high level of corporate debt in China.

Although inflation is under control and employment healthy, the Chinese government seems to be worried about corporate debt and has, therefore, asked State-owned enterprises to fund purchases through cash flow rather than on credit.

According to experts, the metals and mining sector in China is not in a good shape. Declining investment growth and falling property prices have generated fears that the 2015 GDP growth target may be lowered. 

There are demand concerns is other regions too. Although US recovery is back on track, global growth is still uneven. Demand in Europe and Japan is still fragile.

Of course, many emerging markets show signs of stabilising with activities being adjusted to global realities. The US Fed’s monetary policy normalisation is seen as another uncertainty as expectations differ about the timeframe. Geopolitical tensions may have somewhat receded, but the Russia-Ukraine stand-off and insurgency in Syria and Iraq can potentially create a turmoil.

Simply put, the global environment is full of strong pulls and pressures.

As a result, many commodities are trading close to their cost curve.

Some of the less-efficient producers have shut down. It has also prompted a cut in capacity expansion.

Collapsing metal prices deter fresh investment while investor risk appetite wanes.

Supply demand fundamentals have begun to assert themselves.

Exception
An exception to the general trend of falling base metals prices is nickel whose price surge has been triggered by Indonesian ban on export of unprocessed raw material. Zinc is another exception because of tightening supplies.

Despite all the uncertainties surrounding the base metals market, on current reckoning, nickel will turn out to be a winner next year followed at a distance by zinc.

FMC initiates fresh measures to boost liquidity

FMC initiates fresh measures to boost liquidity
Amid a sharp decline in turnover of the commodity exchanges, the Forward Markets Commission has come out with a revised policy to allow traders to take higher position in commodities traded on the exchanges to improve the depth and liquidity in the market.
To promote transparency and prevent price manipulation in the market, the Forward Markets Commission (FMC) has also directed bourses to disclose the open position limit of top 10 trading clients, including hedgers, on their Web site.
Open position limit
The revised norms put out on October 20 have come into effect immediately. ‘Open position limit’ refers to the highest number of futures contract that an investor is allowed to hold on one underlying commodity.
According to the latest circular, FMC has come out with a new formula, based on which the gross position limit in agricultural commodities is capped at 50 per cent of the estimated production and imports for all exchanges.
Position limit for brokers, clients
For brokers, the position limit has been doubled and will be 10 times of the client’s level position limit or 20 per cent of the market wide open interest, whichever is higher.
For clients, the position limit will be based on the numerical position limits as decided from time to time or five per cent of the market wide open interest, whichever is higher. For the present, the numerical position limits as existing shall be continued, FMC said.
For considering position limit, a client’s position will be taken in net (of the total) and that of a broker in gross.
In order to promote hedging and arbitrage activities on exchanges, FMC said that it has decided to exempt the quantity of commodity that a hedger/seller, who has deposited early and pays in early, from the consideration of open position limits.
Commexes turnover
Turnover of the commodity exchanges has declined by over 53 per cent to Rs. 31.82 lakh crore till October 15 this fiscal from Rs. 68.42 lakh crore in the year-ago.
The turnover has been affected due to imposition of the commodity transaction tax from July 2013 and the Rs. 5,600 crore payment scam at the spot exchange NSEL.

Brazil’s Vale close to becoming world’s largest nickel producer

Brazil’s Vale close to becoming world’s largest nickel producer
Brazil’s Vale (NYSE:VALE) is growing its nickel output at a pace that not even its own executives were able to predict, with the Rio de Janeiro-based iron ore giant posting Thursday a 16% production increase of the stainless steel ingredient.
Nickel production totalled 72,100 tonnes in the September quarter, which is the best third-quarter performance since 2008, Vale said.
The figure takes the miner’s total output of the metal this year to 201,400 metric tons and its next production target of 289,000 tons in 2014, higher than predicted by Norilsk Nickel, the world's largest producer of the metal
The figure takes the miner’s total output of the metal this year to 201,400 metric tons and its next production target of 289,000 tons in 2014, higher than predicted by Norilsk Nickel, the world's largest producer of the metal, which plans to produce 230,000 tons this year volume.
The historic output was reached despite planned maintenance at the company’s Thompson mine in Canada, Vale added.
Nickel production at the firm’s Canadian mines increased 18.7% year-on-year in the third quarter of 2014, reaching 41,700 tonnes, on higher volumes at its Sudbury and Thompson operations.
Analysts watch Vale's base metals division, of which nickel is the largest component, to see if it can help offset falling revenue from iron ore.
Deutsche Bank experts expect nickel to peak at $27,000 a metric ton in 2017. However, nickel for delivery in the last three months fell 0.4% to $15,145 a ton in London Thursday, the lowest since March 3.
Vale is expected to release its third-quarter financial results later this month.

LME Zinc to avg $2,520 a ton in 2015: Natixis

LME Zinc to avg $2,520 a ton in 2015: Natixis
LME zinc prices are expected to average $2,520 a ton next year and $2,725 a ton in 2016, said Natixis in a Metals Review.
As the zinc market has progressively tightened over the past year, so zinc prices have rallied from less than $1,900 a ton throughout much of 2013 to around $2,300 a ton in September this year.
Despite forecasts for modest demand growth over the coming two years, the global zinc market is expected to tighten further as supply becomes increasingly constrained, and new mines are not expected to arrive until existing inventories are dangerously close to depletion.
Against such a backdrop, Natixis would expect to see substantial upward momentum in zinc prices over the period 2015-16.
In Natixis central scenario, after averaging around $2,200 a ton in 2014, they would expect zinc prices to push up to an average of $2,520 a ton in 2015 before $2,725 a ton in 2016.

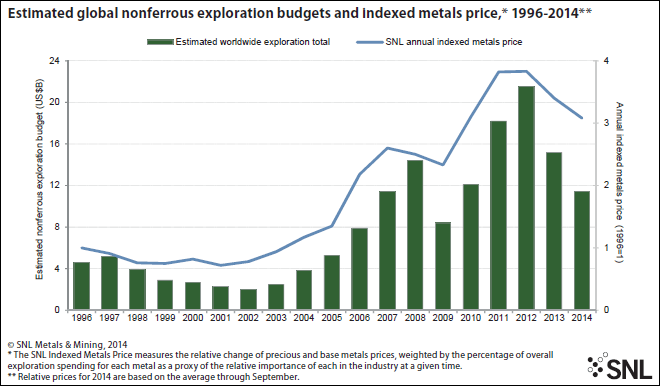
Worldwide nonferrous metals exploration budgets down 25% in 2014

According to data compiled for the forthcoming 25th edition of SNL Metals & Mining's "Corporate Exploration Strategies" study, the estimated worldwide total budget for nonferrous metals exploration dropped to US$11.36 billion in 2014 from US$15.19 billion in 2013 — a 25% decrease
.
SNL Metals & Mining's 2014 exploration data and analysis are based on information collected from almost 3,500 mining and exploration companies worldwide, of which almost 2,000 had exploration budgets for 2014. The companies, each budgeting at least US$100,000, budgeted a total of US$10.74 billion for nonferrous exploration in 2014. Including our estimates for budgets we could not obtain, the 2014 worldwide exploration budget comes to US$11.36 billion. Nonferrous exploration refers to expenditures related to precious and base metals, diamonds, uranium and some industrial minerals; it specifically excludes iron ore, aluminum, coal, and oil and gas.

Higher operating and capital costs, lower ore grades, uncertain demand for commodities and investor discontent have required major companies to focus on a return to healthy margins after years of growth-oriented spending. To that end, the majors have been divesting noncore assets and cutting back on capital project and exploration spending, which has led to an unsurprising 25% drop in the majors' exploration budget total in 2014. The juniors continue to battle lackluster investor interest, which has forced the group to rein in spending in order to conserve funds. The juniors' total exploration budget fell 29% year over year in 2014 after falling 39% in 2013, dropping their share of the overall budget total to 32% from a high of 55% in 2007.

Worldwide nonferrous metals exploration budgets down 25% in 2014
Exploration allocations for all targets except platinum group metals decreased in 2014. Although gold remains the most attractive target, gold budgets declined for the second consecutive year — dropping 31% to US$4.57 billion — to account for the metal's lowest share of worldwide exploration budgets since 2009 at just 43%. Despite base metals budgets falling by US$1 billion, their collective share of total budgets increased 2% to reach the highest level since 2008. Base metals and gold allocations have a consistently inverse relationship in terms of their shares of overall budgets.

Despite lower allocations for most countries, companies continue to explore across the globe; exploration is planned for 124 countries in 2014, down from 127 in 2013. The share of budgets allocated to mature mining regions such as Canada and the United States fell in 2014; Canada's total budget was down 22% year on year due to weakness in the country's junior sector, while the United States' total declined 27% as many major copper producers scaled back exploration programs. Canada and Australia remained the top countries overall, with the United States, Mexico, and Chile rounding out the top five. Although Latin America's 26% year-over-year decline is relatively on par with the overall decrease in exploration budgets in 2014, two of the top exploration destinations within the region, Argentina and Colombia, saw declines of 46% and 42% respectively due to local opposition to mining and political instability. West Africa declined more than the African region — 38% compared with 28% — due primarily to the faltering gold price and regional insecurity; the Ebola crisis will almost certainly result in even further cutbacks to West Africa exploration programs in the second half of 2014.

For the first time since SNL Metals & Mining began the series of "Corporate Exploration Strategies" studies, the proportion of overall exploration budgets dedicated to mine site work surpassed the budget for grassroots activity. Since 2012, producers have been increasingly emphasizing brownfields programs as a less capital-intensive and less risky means of replacing and adding reserves. The proportion of the annual total allocated to grassroots exploration hit a record low this year, as many junior companies, which have historically accounted for the largest portion of grassroots spending, sharply curtailed programs to conserve cash as the exploration sector struggles to rebound from a two-year downward trend. This reduced focus on early stage and generative work has led to concern that many companies, and perhaps the industry in general, are sacrificing long-term project pipelines in favor of consolidation and maximizing returns.

Friday, October 24, 2014

This Is Who Is Quietly Buying All The Cheap Oil

With the US Shale Oil industry up in arms, Venezuela screaming, and Russia awkwardly quiet (as the Ruble slides with the falling oil price stabilizing domestic inflows)the 'secret' Saudi-US oil deal that pressured prices for crude down to $80 (18-month lows today) has 'hurt' a lot of the world's producer nations. However, as Bloomberg reports, there is one nation that is very grateful. The number of supertankers sailing toward China’s ports surged to a nine-month high as over 80 very large crude carriers (VLCCs) - the industry’s biggest ships - sail toward the Asian country’s ports. At an average of 2 million barrels each, the 160 million barrels will help refill China's 727 million barrel SPR which it started in 2012.

This Is Who Is Quietly Buying All The Cheap Oil


The number of supertankers sailing toward China’s ports surged to a nine-month high amid speculation an oil-price slump is encouraging the world’s second-biggest crude importer to accelerate purchases.

There are 80 very large crude carriers, the industry’s biggest ships, sailing toward the Asian country’s ports, according to IHS Fairplay vessel-tracking signals compiled by Bloomberg at about 10 a.m. today. That’s the highest since Jan. 3. Average shipments are 2 million barrels.

Brent crude, the global benchmark, plunged to a four-year low yesterday amid speculation Saudi Arabia, Kuwait and other nations in the Organization of Petroleum Exporting Countries won’t curb production. The slump is likely encouraging buying to fill China’s strategic stocks, according to Energy Aspects Ltd., a London-based consultant.

“There’s a lot of bargain hunting going on,” Richard Mallinson, an analyst at Energy Aspects, said by phone. “Whilst prices are low we think there’ll be buying for Strategic Petroleum Reserve filling and also just trying to capture these discounted crudes.”

...

The 80 bound for China compare with an average of 63 for the past two years and match a record in data that started in October 2011.
*  *  *
In summary, just like Chinese gold imports rise when the price of gold drops; so China does the logical thing with other commodities, (i.e. oil) when prices tumble and instead of selling into the paper rout, it buys all the physical it can get its hands on.