 Orignal Post :- Forex Useful
Monday, May 5, 2014

Forex Market Hours Info-Graphic

Orignal Post :- Forex Useful
FOREX MARKET HOURS
The Forex markets are effectively open 24 Hours a day 5 Days a week. However, each region has its own “official” hours as follows (all times are UK Local time):
• London – Opens at 08:00 and closes at 17:00
• New York – Opens at 13:00 and closes at 22:00
• Sydney – Opens at 22:00 and closes at 07:00
• Tokyo – Opens at 00:00 and closes at 09:00
• New York – Opens at 13:00 and closes at 22:00
• Sydney – Opens at 22:00 and closes at 07:00
• Tokyo – Opens at 00:00 and closes at 09:00
The term “official” is used because there are no strict limits as to when an institution can or cannot trade any specific currency. However, the above “official” times can be used as a fairly accurate set of guidelines.
During these “official” hours trading in certain Key currencies is at its highest, for example:
• The British Pound (GBP) and the Euro (EUR) are most heavily traded during the London session
• The US Dollar (USD) is most heavily traded during the New York session
• The Aussie Dollar (AUD) is most heavily traded during the Sydney session
• The Japanese Yen (JPY) is most heavily traded during the Tokyo session
• The US Dollar (USD) is most heavily traded during the New York session
• The Aussie Dollar (AUD) is most heavily traded during the Sydney session
• The Japanese Yen (JPY) is most heavily traded during the Tokyo session
13:00 – 17:00 is considered “Prime time” as this is when 3 of the most popular currencies (USD, EUR & GBP) are all being actively traded.
It is also important to pay particular attention during the 1st hour of each session as the markets are more volatile for the currencies in their respective regions.
Types Of Trader Info-Graphic

Orignal Post :- Forex Useful
Types Of Trader
There are a number of different types of Trader and the category they fall into is largely determined by the chart time frame they trade.
Scalper
Trades the Tick or 1 Minute chart and tries to catch quick moves in the market. In and out in less than an hour, sometimes minutes. Trades a few times an hour, these guys enjoy lots of action.
Day Trader
Trades the 5 – 15 Minute chart and tries to catch the market move of the day. In and out in the same day and usually less than a couple of hours. Trades a few times a day, these guys enjoy lots of screen time.
Swing Trader
Trades the 1 Hour or 4 Hour chart, also known as Trend trading. In and out in a few weeks but some trades can run for months. Trades a few times a week, these guys are quite relaxed.
Position Trader
Trades the Daily and Weekly charts and takes a long term perspective. Positions are often left to run for months, sometimes years. Trades a few times a month, these guys also observe the fundamentals.
Summary
If you enjoy lots of action become a Scalper. If you enjoy lots of screen time then it’s Day Trading for you. For a more relaxed approach try Swing trading and if you are into fundamentals Long term Position Trading will be your choice.
Bullish US $ index view at risk. 79.26 is KEY, Watch the Russell 2000 and its 200d avg & Don't Fade The Bond Rally, BofA Warns
Bullish US $ index view at risk. 79.26 is KEY

The breakdown in US 10yr yields threatens our bullish US $ Index outlook, as well as our long $/Chf position and topping view in €/$. However, for now we are sticking to our call. A US $ Index break of 79.26 (the Mar-13 low) says our view is misplaced and opens significant US $ index downside.
Watch the Russell 2000 and its 200d avg

We are becoming increasingly concerned about small cap and tech stocks. Indeed, the Russell 2000 is dangerously close to its 200d (1113). A closing break below would expose 5yr trendline support (1057) and could lead to a bout of n/term risk aversion. This is bullish Treasuries.
10yr USTs threaten the US $
US 10yr Treasury yields take center stage next week. After 3 months of range trading, they have resumed their year-to-date downtrend. The Friday Bearish Outside Bar (a bearish chart pattern indicating further downside) and closing break of the 2.591% range lows says lower 10yr yields are coming. We target the 2.420%/2.399% multi-year pivot zone and potentially below. DON’T FADE THIS BREAKDOWN. Watch US equities.
While the S&P500 is still constructive, small caps and tech remain vulnerable. Indeed, the Russell 2000 is dangerously close to its 200d moving average, a close below which could lead to a bout of risk aversion and be the catalyst for further yield weakness. From an FX perspective, the 10yr yield breakdown threatens our bullish US $ index / bullish $/CHF. HOWEVER, FOR NOW WE ARE STICKING TO OUR GUNS. A break below 79.26 (US $ Index), 0.8699 ($/CHF) and above 1.3967 (€/$) forces us to reassess. In contrast, the yield breakdown increases our n/term bearish conviction on $/¥.
Chart of the week: 10yr Treasuries return to trend

The Friday Bearish Outside Bar and close below the 3m range lows say that 10yr yields have returned to a downward trending environment. In the sessions weeks ahead we target the 2.420%/2.399% pivot zone and potentially below.
$/¥ takes aim at its 200d avg and below

In contrast to our bullish US $ Index view, we remain near term $/¥ bears. Indeed the breakdown in 10yr yields adds to this bearish conviction. In the sessions ahead we look for a test and break of the pivotal 200d (now 101.00), targeting the 99.37 swing target.
Barclays cuts Q2 price forecast for LME Copper from $7,300 to $6,900 a ton
 British banking giant Barclays has marked lower their LME copper second-quarter price forecast from $7,300 a ton to $6,900 a ton but continue to see upside from current levels.
According to Barclays. first-quarter LME copper prices were in line with their forecast of $7,100 a ton, averaging $7,037 a ton.
Barclays maintains their second half price forecast for LME copper to trade around $7,000 a ton. Much will depend on China. The strong sequential recovery in Chinese economic growth our economists are forecasting will be needed to prevent a ballooning copper market surplus.
Chinese market participants have indicated demand has begun to pick up. Factories reported a moderate bounce in orders that allowed them to source more raw materials. The State Grid Corp of China awarded two rounds of tenders in March, and other infrastructure projects are also under way. At the same time, government reassurances that China could deliver growth began to steady sentiment.
However, demand is still best described as lukewarm rather than very hot. YTD State Grid transformer tenders are still 13% lower y/y, and tight credit continues to constrain a variety of activities, from construction to property sales, said Barclays.
Barclays expects imports to begin to thin in the coming months, reflecting soured financing appetite and high bonded inventories. While recent feedback suggests that inventories have flattened as outflows from the warehouses to the domestic market roughly offset imports and smelter deliveries to the warehouses, Chinese demand needs to pick up more strongly for the market to rebalance.
Barclays maintains 2014 LME Lead price forecast at $2,239 a ton
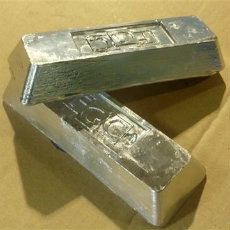 Barclays maintains their full year LME lead price forecast at $2,239 a ton while the metal's first-quarter prices were slightly softer than expected averaging $2,105 a ton, compared with their forecast of $2,200 a ton.
According to Barclays, the fundamental picture for lead continues to look constructive with the market in a modest deficit and reported stocks-to consumption very low.
Data from the ICSG show that the US lead market deficit continues to increase, though we believe that may be partially exaggerated by record-high imports in January.
Barclays understands that some of those imports went to unreported stock builds, with market participants keen to hold a more comfortable inventory buffer given the lack of domestic production following the closure of the Herculaneum smelter.
Globally, demand is being supported by the build out of 4G networks, especially in China, India and, to a lesser extent, Africa. Stationary battery demand for this use is expected to be a significant contributor to global lead demand alongside solid transportation demand, especially in China and from a recovering European autos market.
The restructuring of Exide Technologies could further tighten the US market depending on what it decides to do with its smelter assets. Regardless, the risk is for significant disruption since a sale would require new owners to make the facilities environmentally compliant. Alternatively, if Exide kept its US smelters, it could use this to feed at least part of it battery operations. However, smelter upgrades would still be required, leading to closures and likely production disruptions, which could tighten US supply further.
Aluminum demand underpins by improving economy, emissions rules: BofAML
 Demand for aluminum is underpinned by an improving economy and tighter emissions regulations for automobiles, said Bank of America Merrill Lynch.
The fundamental backdrop outside of China has especially improved, and the bank says the world excluding China may post a 590,000-metric-ton supply deficit this year after a 3.2 million-ton surplus in 2009.
“Focusing on demand, the rebound in offtake was of course heavily influenced by a recovery of economic activity, highlighted also in aluminum demand's beta of two times global GDP growth,” the bank added.
“The cyclical boost has been mirrored in a high correlation between global vehicle sales and the metal's consumption as well.” In addition to higher vehicle production, the sector’s shift toward lighter vehicles, in order to meet emissions standards, also means more use of aluminum in cars,” said the analysts with Bank of America Merrill Lynch via Kitco News.
“Car manufacturers can comply with stricter regulations by a combination of factors, including a reduction in vehicle weight. Considering that aluminum has a lower density compared to other raw materials like steel, it can be a material of choice to reduce a vehicle's weight,” the bank concluded.
Subscribe to:
Posts (Atom)