Showing posts with label ENERGY = Crude Oil & Natural Gas. Show all posts

Tuesday, January 12, 2016

Crude oil prices fall as much as 20% since beginning of the year

Crude oil prices fall as much as 20% since beginning of the year

Crude oil prices continued a relentless dive early on Tuesday, falling as much as 20 per cent since the beginning of the year as analysts scrambled to cut their 2016 oil price forecasts and traders bet on further price falls.
US crude West Texas Intermediate (WTI) was trading at $30.98 per barrel at 0311 GMT on Tuesday, down 43 cents from the last settlement and more than 19 per cent lower than at the beginning of the year. WTI has shed over 70 per cent in value since the downturn began in mid-2014.
Brent crude futures fell 43 cents to $31.12 a barrel. Earlier they declined to $31.08, their lowest since April 2004. Brent has fallen 20 per cent in January and, like WTI, has declined on every day of trading so far this year.
Traders take record short positions
Trading data showed that managed short positions in WTI crude contracts, which would profit from a further fall in prices, are at a record high, implying that many traders expect further falls (see chart).
Analysts also adjusted to the early price rout in the year, with Barclays, Macquarie, Bank of America Merrill Lynch, Standard Chartered and Societe Generale all cut their 2016 oil price forecasts on Monday.
"A marked deterioration in oil market fundamentals in early 2016 has persuaded us to make some large downward adjustments to our oil price forecasts for 2016," Barclays bank said.
"We now expect Brent and WTI to both average $37/barrel in 2016, down from our previous forecasts of $60 and $56, respectively," it added.
$10/barrel?
But it was Standard Chartered that took the most bearish view, stating that prices could drop as low as $10 a barrel.
"Given that no fundamental relationship is currently driving the oil market towards any equilibrium, prices are being moved almost entirely by financial flows caused by fluctuations in other asset prices, including the USD and equity markets," the bank said.
"We think prices could fall as low as $10/bbl before most of the money managers in the market conceded that matters had gone too far," it added.

Friday, May 29, 2015

Oil Prices Drop To 7-Week Lows - Here's Why

WTI Crude hit new 7-week lows, dropping below $57 (front-month) for the first time since April 15th's 'inventory draw' rip. In addition to reports from Reuters of leaked details about OPEC not expectated to cut production (did anyone really expect that), a combination of renewed inventory builds (as reported by API last night) and reports that Iraq is increasing its supply to new record highs is forcing futures prices to catch down to physical markets.

Oil Prices Drop To 7-Week Lows - Here's Why
Weakness driven by...Iraq supply concerns...(as RT reports)
Iraq is ready to increase its crude exports to a record 3.75 million barrels per day in June, continuing OPEC’s strategy of ousting US shale producers from the market.

The extra oil from Iraq comes to about 800,000 barrels per day, more than from another OPEC member, Qatar, said Bloomberg, referring to Iraq's oil shipments schedule.

Iraq is increasing oil exports in two directions. The first is in the Shiite south, where companies such as BP and Royal Dutch Shell work. The second is Nothern Iraqi Kurdistan, whose government last year received Baghdad's consent to independent oil deliveries.

In April, Iraq exported almost 3.1 million barrels of oil per day, which is a record.
And Iran remains a worry...
Oil Prices Drop To 7-Week Lows - Here's Why

And inventory builds reappear...
Oil Prices Drop To 7-Week Lows - Here's Why

And leaked details of OPEC's report suggests no cut in production... (via Reuters)
OPEC is not expected to cut oil production at its meeting in June, and the meeting is expected to be a short one, Saudi Arabia's Al Hayat newspaper quoted an unnamed OPEC source as saying on Thursday.

Saudi Arabia will continue producing oil to meet customer demand, and its output is now at about 10.3 million barrels per day in light of growth in demand from China and India, the source added.
*  *  *

Wednesday, March 18, 2015

WTI Plunges To $42 Handle On Massive API Inventory Build

For what appears to be the 10th week in a row, API reports a massive 10.5 million barrels (far bigger than the 3.1 million barrel expectation) and a 3 million barrel build at Cushing. If this holds for DOE data tomorrow (and worryingly API has tended to underestimate the build in recent weeks) it will be the biggest weekly build since 2001. WTI has plunged on this news hitting $42.60 on the April contract.

WTI Plunges To $42 Handle On Massive API Inventory Build

If API data is accurate (and it has tended to underestimate the inventory build in recent weeks) then this will be the biggest build since 2001...
WTI Plunges To $42 Handle On Massive API Inventory Build


Monday, March 16, 2015

The US is running out of room to store its oil: Greenspan

The US is running out of room to store its oil: Greenspan
Oil production has not eased despite low prices and America's major storage facility is running out of room, said former Federal Reserve Chairman Alan Greenspan on Bloomberg TV on Friday.
Greenspan expected supply to ease but noted that data shows domestic crude production continues to rise:
If you look at the data, our major domestic facility for storage is in Cushing, OK, which is a delivery point for West Texas Intermediate crude contracts. We're probably at the point now where at the current rate of fill we are going to run out of room in Cushing by next month. The question then is where does the crude go? Everyone's forecast was . . . prices collapse and a sharp curtailment of shale oil production. That has not happened. The weekly figures produced by the [energy administration], through March 6, showed a continued rise in domestic crude production, and it's got no place to go because we can't legally export the way we could with most products.
Essentially, we are bottling up a huge amount of crude oil in the United States so if the West Texas Intermediate is running $10 a barrel under Brent Crude, which is the global price. That means we are creating great abnormalities in the system and unless we find a way to get out of this dilemma, prices will continue to ease because there is no place for that oil to go.
Greenspan said the large price differences between WTI and Brent will result in a volatile spot price for oil.
Hat tip, Business Insider

Thursday, February 19, 2015

WTI Crude Slumps To $50 Handle On Larger-Than-Expected Inventory Build

API released its crude oil inventory data to subscribers and it printed an enormous 14.3 million barrel build (EIA tomorrow forecast at 3 million barrel build). This has sparked further weakness in WTI (not helped by refinery strikes, refinery fires, and storage capacities), pushing it to a $50 .

WTI back with a $50 
WTI Crude Slumps To $50 Handle On Larger-Than-Expected Inventory Build

One word - Stabiliteee.....
WTI Crude Slumps To $50 Handle On Larger-Than-Expected Inventory Build


Thursday, February 5, 2015

Oil Enters Correction A Day After It Enters Bull Market

Well that escalated quickly...

From $43.58 to $54.24 to $47.95...
Oil Enters Correction A Day After It Enters Bull Market

Explaining why.
Oil is down because rigs are being opened and oil was up because rigs were being closed.

Thursday, January 15, 2015

Crude Oil Prices Are Spiking Into Close

WTI Crude futures are up almost 6%, spiking above $48.50 into the close and options expiration... no fundamental catalyst for now... Once again, crude futures have been 'spoofed' all day so this is hardly a surprise.
Back into the green on the week...
Crude Oil Prices Are Spiking Into Close

Wednesday, January 14, 2015

Copper & Crude Convolutions: "The More This Goes On The More It Looks Like 1937"

The primacy of the monetary pyramid in 2015 is not really about money as it is all ideology. If you believe that monetary policy provides “stimulus” then you immediately remove all thoughts of any economic decline during times when monetarism is most active. Since “it works” then all else must fall into place. Contrary indications are thus given extraordinary lengths to maintain logical consistency.
Economic commentary as it exists is incredibly short-sighted, though there is no reason to believe that is anything other than exactly what I stated above. The state of economics even as a discipline has internalized Keynes so deeply that all that matters is what happens month-to-month. That makes it easier to maintain the status quo of opinion about “stimulus” – in the short run it is very easy to find a suggestion for something behaving “unexpectedly.”
That was certainly the case with crude oil prices these past few months, as the initial impulse was uniformly and incessantly prodded to over-supply. Again, the reasoning behind that was simply since “stimulus” works and it was being practiced and replicated all over the world there was no possible means by which “demand” might drop, and so precipitously. After a few weeks of oil “unexpectedly” falling further, re-assurances were more difficult and increasingly derivative by nature.
The parallel excuse was that oil prices were oil prices and that very little else “important” was behaving as was crude. And whatever commodity prices were falling in parallel fashion, that was distilled as being nothing more than either an oil “echo” or supply everywhere. This was written in November 2014:
The simple reason for the dip in commodities prices, these experts say, is that we have too much of a good thing: too much gold; a bumper crop of corn; a glut of iron ore because the big three producers, Rio Tinto, Vale and BHP Billiton have all increased output. In crude oil, members of the Organization of Petroleum Exporting Countries keep pumping out oil, while US production is at its highest level since 1986…

That lack of demand is why the commodity markets aren’t forecasting bad times in the future; they’re mirroring the current dark “mood” of the commodity investor, said analysts at Citi Research in a research note from 16 November.
The article should have just come right out and stated the central theme: commodity “investors” are in a “dark mood” because the world is so good right now. And while that may hold some minor plausibility on the surface, it is, again, far too narrow and focused solely on this moment. Even if commodity prices were, in fact, trading only on over-supply, therein lies the seeds of the next economic problem anyway. What factor in this economic world would lead to such an imbalance in the first place?
After all, businesses are supposed to be set on expectations for future conditions, and this narrative more than suggests that they were decidedly bad at doing so. Producers that so over-produce themselves into big trouble are either really stupid, or led astray by prices that, at their core, don’t make fundamental sense.
In other words, even if you follow this tendency to excuse “unexpected” weakness, it still amounts to largely the same problem – an artificial “boom” predicated on artificial prices rather than something more fundamentally sound and thus sustainableIt all ends up in the same place as an imbalance that will have to be cleared via retrenchment; a fact that is missed in the euphoria of “this month is compared only to last month.”
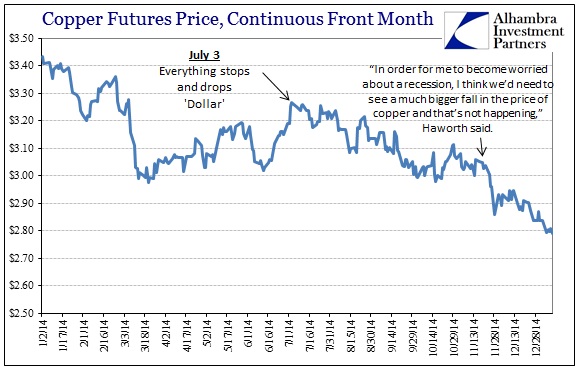
One reason Haworth said he’s not worried about a bigger global recession is the behavior of copper prices. Because the red metal has many industrial uses, commodity watchers will sometimes say copper has “a PhD in economics”, and it can be a gauge of future industrial demand. US copper futures prices have dipped below $3 a pound on rare occasions in 2014, but it’s always bounced back up. Prices currently are around $3.04.

Haworth called that “heartening” and posits copper prices are suggesting that while global growth is not strong, it’s not falling apart.

“In order for me to become worried about a recession, I think we’d need to see a much bigger fall in the price of copper and that’s not happening,” Haworth said. [emphasis added]
Almost immediately upon having those words printed, the price of copper declined below $3 and has remained lower ever since; in fact still falling further even now. I don’t profess to know at what price Mr. Haworth would consider low enough to change his global recession stand, but in wider context it is clear that the possibility has already been more than suggested.
Copper & Crude Convolutions: "The More This Goes On The More It Looks Like 1937"
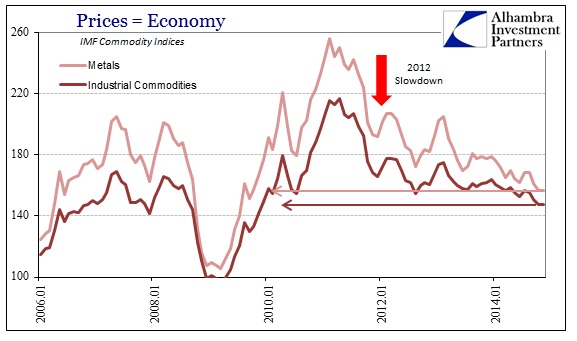
As of this morning, the front month futures price of copper delivery is almost exactly the same price as it was in June 2010 at the lows when recovery after the Great Recession was very much in doubt – leading to QE2 and the last great “rip” in commodity prices (as if that were a good thing). It only matters that copper prices are not wholly collapsing right now, in scale closer to what happened starting July 2008, if your view of the world is temporally tapered. Taking a longer view, copper prices have been falling since the 2011 apex of the $/€ crisis, with the longer-term trend established in early 2012 as global growth (demand) has done nothing but wane.
In a physical world where supply and demand have to clear at some price, it is not really surprising that a slow attrition in economic activity would show up as a much more durable and extended slide in not just copper, but almost every economically-sensitive commodity. Since that trend includes the beginning and end of QE 3 & 4, as well as innumerable “stimulus” programs in Japan, Europe, China and elsewhere, with nary a durable upward impression, it speaks very ill of the impact of monetarism on actual “demand”, even if it were “over-supply.”
ABOOK Jan 2015 Copper IMF Indices
The mainstream impression of all of this is one of independent and discrete trends with no unifying nature. That fits the idea that “market” prices can be as they are without disrupting the narrative of an economy on the upswing. But the financial system, especially globally, does not behave as a segregated and compartmentalized price engine – and certainly not for extended periods. The fusion of all these pieces, and why crude collapse is really indicative of the underlying trend, is, of course, the “dollar.”
ABOOK Jan 2015 Copper Short
In a globalized and financialized world, financial disruption, which is what a “rising” dollar signifies, is not an independent paradigm. The more prices trend exactly opposite of how “stimulus” is supposed to work, the less these convolutions will hold up whereby, eventually, reality sets in. The significance of the action in December is that there are no more lines in the sand left to defend the “honor” of monetarism; copper isn’t anywhere near $3 anymore and the long-predicted crude oil bounce to $70 is instead $45 and falling. Only equities remain, and at these valuations they signify nothing but the folly of the artificial economy. The more this goes on, the more it looks like 1937 lives again.

Sunday, January 11, 2015

Do Stocks Always Fall After Crude Crashes?

Not always, but you will have to consider modern finance this time?
Modern finance
- Hedging protection
- Debt and derivatives blow ups associated with Oil companies.
- Percentage of economic growth lost verses benefit of cheaper oil.
As always timing is the factor, how much pain will be felt before we get the gain? The next 12 months will be rocky as the bad oil news flows through the market.
Chart: Crude oil on top, Dow Jones on the bottom.
Do Stocks Always Fall After Crude Crashes?
Source readtheticker.com

Tuesday, January 6, 2015

"There Is Moar Blood" WTI Crude Plunges Into The $40s

WTI crude oil prices are now down almost 55% from the June highs, the impossible just happened... WTI Crude broke into the $40s... the 6-month plunge is the largest since the pre-Lehman plunge and 2nd biggest plunge in 28 years.

WTI back under $50...
"There Is Moar Blood" WTI Crude Plunges Into The $40s
Ugly...
"There Is Moar Blood" WTI Crude Plunges Into The $40s

Unequivocally not good...

"There Is Moar Blood" WTI Crude Plunges Into The $40s

Energy stocks have ropundtripped to pre-Fed levels...
"There Is Moar Blood" WTI Crude Plunges Into The $40s

Jeff Gundlach: "If Oil Drops To $40 The Geopolitical Consequences Could Be Terrifying"

In a recent interview with FuW, DoubleLine's Jeff Gundlach explained his concerns about the oil market not being "unequivocally good" for everyone...
Question: The crash in the oil market is already causing jitters in the financial markets around the globe. What is your take on that?

Gundlach: Oil is incredibly important right now. If oil falls to around $40 a barrel then I think the yield on ten year treasury note is going to 1%. I hope it does not go to $40 because then something is very, very wrong with the world, not just the economy. The geopolitical consequences could be – to put it bluntly – terrifying.
What would that mean for stocks?
Jeff Gundlach: "If Oil Drops To $40 The Geopolitical Consequences Could Be Terrifying"
Gundlach is right historically...
Large and rapid rises and falls in the price of crude oil have correlated oddly strongly with major geopolitical and economic crisis across the globe. Whether driven by problems for oil exporters or oil importers, the 'difference this time' is that, thanks to central bank largesse, money flows faster than ever and everything is more tightly coupled with that flow.

Jeff Gundlach: "If Oil Drops To $40 The Geopolitical Consequences Could Be Terrifying"

So is the 45% YoY drop in oil prices about to 'cause' contagion risk concerns for the world?
*  * *
Of course Gundlach is not alone in this rational concern...
"In its November 14, 2014 Daily Observations ("The Implications of $75 Oil for the US Economy"), the highly respected hedge fund Bridgewater Associates, LP confirmed that lower oil prices will have a negative impact on the economy.

After an initial transitory positive impact on GDP, Bridgewater explains that lower oil investment and production will lead to a drag on real growth of 0.5% of GDP.

The firm noted that over the past few years, oil production and investment have been adding about 0.5% to nominal GDP growth but that if oil
levels out at $75 per barrel, this would shift to something like -0.7% over the next year,creating a material hit to income growth of 1-1.5%."

-- Mike Lewitt, The Credit Strategist
Source: Bloomberg

Sunday, January 4, 2015

Natural gas eases off 2-year lows on cold weather outlook

Natural gas eases off 2-year lows on cold weather outlook
Natural gas futures were higher on Friday, easing off two-year lows as reports of an outbreak of cold January weather was expected to stoke demand for the heating fuel.
On the New York Mercantile Exchange, natural gas futures for delivery in January were up 4.83% at $3.029 per million British thermal units during U.S. morning trade.
Natural gas futures found support after the U.S. government’s Global Forecast System published earlier in the week showed "a stronger cold push" in the Midwest.
The report also showed lower temperature readings for the Plains, Texas and the Northeast for January 3 through January 7, while forecasts turned colder in the central and northern mid-Atlantic regions for the following five days.
However, forecasts from Commodity Weather Group on Friday indicated that the weather in January will be 6.7% warmer than a year earlier.
Natural gas prices dropped below $3 per million British thermal units last week to the lowest level since September 2012, as unusually mild winter weather limited demand while production soared.
On Wednesday, the U.S. Energy Information Administration said in its weekly report that natural gas storage fell by 26 billion cubic feet last week, compared to expectations for a decline of 38 billion after a drop of 49 billion in the previous week.
Total U.S. natural gas storage stood at 3,220 trillion cubic feet.
Approximately 49% of U.S. households use gas for heating, according to the EIA, the statistical arm of the Energy Department.

Thursday, December 25, 2014

Natural Gas Suggests $33 Oil

In the last couple of months, the sharp reversion in oil prices has certainly caught the world’s attention.  While the majority of economists and analysts continue to expect incorrectly that falling oil prices are a positive input to economic growth, the reality is that it is not.  The negative impact to economic growth from the decline in oil prices are quite considerable when you consider that almost 40% of all the jobs created since 2009 have been in energy related industries. 
Furthermore, many of those jobs are in the highest wage paying areas of the country that leads to more consumption and further job growth in other areas of the economy.  In fact, for each job created in the energy sector there are nearly three jobs created elsewhere in the economy.
“What we have here is a failure to communicate.” - Cool Hand Luke, 1967
As I discussed at length previously, the current problem in the energy price is a realization of a supply / demand imbalance.
"First, the development of the‘shale oil’ production over the last five years has caused oil inventories to surge at a time when demand for petroleum products is on the decline as shown below."
Natural Gas Suggests $33 Oil
"The obvious ramification is a ‘supply glut’which leads to a collapse in oil prices. The collapse in prices leads to production‘shut-ins,’loss of revenue, employee reductions, and many other negative economic consequences for a city dependent on the production of oil.”


$33 Oil – A Return To Normalcy
While the economists and analysts are hopeful for a sharp recovery in oil prices, the current decline in oil prices is nothing more than a return to historical normalcy.  Let me explain.
If you ask virtually any oil and gas professional, that has been around the industry longer than the graduating class of 2000, they will tell you that the historical relationship between oil and gas prices is roughly $8.  The chart below shows the highly correlated history of oil and gas prices until 2008.
Oil-Natgas-122314
Not surprisingly, the divergence between oil and gas prices came to fruition in conjunction with the massive interventions by the Federal Reserve, which lowered borrowing costs enough to sufficiently provide for funding of higher cost shale exploration.  As Yves Smith recently stated:
“The oil and gas sector is capital intensive. Drillers have borrowed phenomenal amounts of money, which was nearly free and grew on trees, to acquire leases and drill wells and install processing equipment and infrastructure.Even as debt was piling up,the terrific decline rates of fracked wells forced drillers to drill new wells just keep up with dropping production from old wells, and drill even more wells to show some kind of growth.One heck of a treadmill. Funded in part by junk debt.
Junk bond issuance has been soaring as the Fed repressed interest rates and caused yield-hungry investors to close their eyes and take on risks, any risks, just to get a teeny-weeny bit of extra yield. Demand for junk debt soared and pushed down yields further. And even within this rip-roaring market for junk bonds, according toBloomberg,the proportion issued by oil and gas companies jumped from 9.7% at the end of 2007 to 15% now, an all-time record.”
With an excess supply now realized, particularly as global demand continues to wane, oil prices are now returning back towards their historical long-term relationship. 
If we assume that natural gas, which has been trading around $4 per BTU, has already returned a more normalized supply/demand range this would imply that oil prices have further to fall. The chart below is an extrapolation of the current West Texas Intermediate Crude price forecasted into 2016 on a monthly basis.  It would currently require a decline in oil prices to $33 per barrel to return the WTIC/NatGas ratio back to its historic spread of $8.
Oil-Natgas-Ratio-122314
As T. Boone Pickens notes in his interview, the main supply / demand divergence is in the process of returning back towards equilibrium particularly in light of the deflationary forces that exist on the global landscape. While it is certainly feasible that we could see a sharp “snap back” rally from the recent plunge in oil prices, it is likely an opportunity to reduce energy exposure in portfolios before the next leg lower.
Just as a reminder, the last time oil prices fell 50% from their peak was in 1985-86.  Oil prices then stayed at those levels until the turn of the century.  The rebalancing of supply and demand could leave oil prices at lower levels for much longer than the majority of analysts currently believe. Considering that oil production related states have done the majority of the work related to the current domestic economic recovery, such an outcome could derail the hopes for a continued economic revival.

Tuesday, December 23, 2014

NatGas Crashes Most In 10 Months As Polar Vortex Arrival Delayed

Natural Gas prices are down over 11.5% in the last 2 days, falling to their lowest price since January 2013, as a familiar tale of excess production in the face of ebbing demand looms large. As WSJ reports, BNP Paribas' Teri Viswanath notes "the delayed return of cold weather has simply curbed all buying interest," and this was exaggerated by technical selling as the market broke previous support around 3.50. Ironically, given its detrimental impact on GDP, Macquarie points out, "it is increasingly apparent to us that weather will need to bail the market out again this winter - otherwise prices could see material downside during the spring and summer months."

Moar tax-cuts, more discretionary spending!! oh and less employment, capex, and EPS for Oil & Gas stocks...
NatGas Crashes Most In 10 Months As Polar Vortex Arrival Delayed
Natural-gas futures slid to their lowest prices this year and entered a bear market Friday, as investors come to grips with surging production that is beginning to push the U.S. toward potential oversupply.

...

“The delayed return of cold weather has simply curbed all buying interest,” said Teri Viswanath, natural-gas strategist at BNP Paribas in New York. “Unseasonably warm weather that persisted through the month of December now necessitates extreme weather conditions to avoid a (gas supply) surplus.”

Analysts said Friday’s selling was partly driven by technically driven trading as the market broke through levels where it previously rebounded.

...

Though the U.S. has begun to draw on natural-gas stockpiles for fall and winter heating needs, continued booming production from U.S. shale fields is helping to replenish supplies. As a result, withdrawals from storage have been smaller than average, and the U.S. has begun to erase a supply deficit that has persisted most of this year, after outsize demand from the severe winter last season dragged stockpiles to an 11-year low.

...

“It is increasingly apparent to us that weather will need to bail the market out again this winter—otherwise prices could see material downside during the spring and summer months,” Macquarie Bank said in a research note. “At this point, winter weather will determine just how low prices can go.”

Monday, December 15, 2014

The Carnage Continues - Middle East Stock Markets Are Bloodbath-ing

Following Friday's US weakness and UAE's hint that $40 oil is coming next, the crude carnage continues as Middle East markets are crashing. As WSJ reports, the bearish direction of oil prices again spooked investors in Dubai where the DFM General Index finished down 7.6%, extending Thursday’s 7.4% rout. The bloodbath extended across the entire region with Abu Dhabi down 3.6%, Qatar slid 5.9%, Kuwait fell 2.9%, and Saudi Arabia’s market, the largest bourse in the region, retreated 3.3%.

Bloodbath-ing...
The Carnage Continues - Middle East Stock Markets Are Bloodbath-ing


As one analyst warned:
"the severity of this decline could very well be explained by investors covering margin calls as leverage was used on the way up over the past year."
And shows no signs of stopping...
The Carnage Continues - Middle East Stock Markets Are Bloodbath-ing

Charts: Bloomberg

Sunday, December 14, 2014

The Crude Crash Comes To Wall Street: Counterparty Risks Rear Their Ugly Heads Again

In late 2006, default rates on lower-rate subprime private MBS began to rise considerably. Though not a very transparent market to the mainstream media-watching world, bankers knew trouble was brewing as this had not happened before in such a benign house price decline. Banks, knowing what they had on their books, what they had sold to others, and what that meant for risk, began quietly buying protection on other banks as counterparty risk became a daily worry for desks across Wall Street.
The stocks of US financials continued to rise amid "contained" and "no problem" comments from the status quo but credit spreads for the major US banks kept leaking wider even as stocks rallied... then reality dawned on stocks and the rest is history.
The Crude Crash Comes To Wall Street: Counterparty Risks Rear Their Ugly Heads Again

Today, US financial credit spreads (wider) have decoupled once again from stocks (higher) and that divergence began as oil prices started to slump.

The Crude Crash Comes To Wall Street: Counterparty Risks Rear Their Ugly Heads Again

Are banks hedging counterparty risk once more 'knowing' what loans and exposures they have to the massively levered US oil industry? Or is it different this time?

Thursday, December 11, 2014

It's Different This Time... Rig-Count Edition

In July 2008, crude oil prices peaked and began to fall quickly. After 2 months they had dropped 30%, but being the smartest extrapolators in the room, producers piled on the rig count driving it higher and higher until around 5 months after oil prices peaked... the rig count completely collapsed. Today, it has now been almost 6 months since oil peaked and began its accelerating free-fall and rig counts have just started to drop (still 2% above the June peak oil levels)...  

There is always a lag... and with permits down 40%, let's just see if it's different this time...
It's Different This Time... Rig-Count Edition

Of course, it's different this time... it's way worse! All these rigs are backed by massive debt loads at drastically lower costs of funding than is possible now... but we should ignore that, right?