Saturday, November 29, 2014

India scraps gold import restrictions

India scraps gold import restrictionsThe Reserve Bank of India has just announced on its website the scrapping of restrictions on gold imports, and the withdrawal of the so-called 20:80 rule which forces traders to re-export 20% of all imports.
The import curbs came into force in August 2013, to shore up the tanking rupee and tackle the country's current account deficit which had ballooned to 5.5% of GDP.
The surprise decision – most observers were calling for a tightening – did little for the price of gold in New York, which was last trading down nearly $20 an ounce at $1,178 an ounce, the lowest in more than two weeks.
Although details of the move still has to be disclosed it's likely that the precipitous fall in the price of oil – India's top import ahead of gold – played a role.
Indian gold imports have surged recently, but the decline in crude price will soften the impact should Indian traders continue to ramp up purchases.

CHART: Another huge Friday gold price takedown

After an uneventful week where gold stayed within striking distance of $1,200 an ounce, Friday saw another big move in the price in heavy volume.
The first gap down came right at the open, when a huge sell order of more than 1.2 million ounces dropped the price out of it's trading range.
Then around mid-day another series of trades took the price down to a day low of $1,163.90, a drop of 2.8% from yesterday's close.
For the session volumes were heavy with the most active contract trading the equivalent of 24 million ounces, almost double the three-month average.
A freefall in the price of oil – down 10% on the day – and doubts about the outcome of the Swiss vote on the country's gold reserves could partly explain the drop.
But the surprise scrapping of import duties by top gold consumer India should have buoyed the price. Even before the lifting of the curbs, India's import of gold rocketed and providing a floor for the physical market.
By the close of trade on the Comex division of the New York Mercantile Exchange gold for February delivery was changing hands not far off the lows at $1,165.80 an ounce, down $31.70.
CHART: Another huge Friday gold price takedown

Friday, November 28, 2014

Brent Crude Crashes 7%,after OPEC meeting

Oil Prices Collapse After OPEC Keeps Oil Production Unchanged
OPEC KEEPS OIL PRODUCTION TARGET UNCHANGED AT 30M B/D: DELEGATE WTI @70 and Brent Crude (under $75 for first time since Sept 2010 are collapsing. Big Positive for India
Brent Crude Crashes 7%,after OPEC meeting
Lowest since June 2010…
Brent Crude Crashes 7%,after OPEC meeting

CHARTS: Dollar destruction of commodity prices could be ending

The gold price drifted lower on Thursday falling below $1,200 and down nearly $10 overnight, hurt by a 6% slide in the price of oil.
The two commodities often move in tandem because cheaper crude leads to lower inflation, tarnishing gold attractiveness as a hedge against faster rates of price growth.
The fall in the price oil has given another boost to the US dollar. Commodities priced in US dollar usually have an inverse relationship to the world's reserve currency.
The greenback's rise to near five-year highs against a basket of currencies has pressurized not on the price of gold, but everything from copper and cotton to milk and molybdenum.
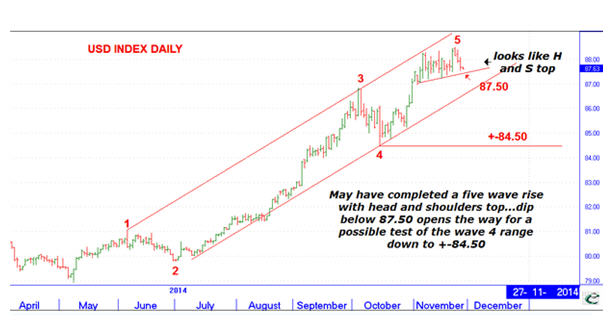
InvesTRAC passed on this price graph to MINING.com indicating that the US dollar's stunning run since May may be close to correcting.
The technical research and investment blog notes the advance from the May low has "unfolded in five waves which ought to be followed by a three wave correction":
The top of wave 5 seems to be tracing out a head and shoulders top and a dip through 87.50 would open the way to violate the uptrend and teat the bottom of wave 4 at 84.50. The technical picture shows InvesTRAC's short term direction indicator has turned down from an overbought situation with the forecaster showing weakness could be expected until the last week of December. So the stage is set for declining dollar and rising to soon get underway.
CHART: Dollar destruction of commodity prices could be ending
InvesTRAC believes the dollar chart confirms movements in the CRB Commodities index and that the decline in the broader commodities index from its June high was probably terminating after a 15.5% decline.
The InvesTRAC short term model shows that the OB/OS indicator has just begun to rise with the forecaster showing a rising ternd into early February. The daily chart below shows a 15 percent rise form the January lows which has more than been taken back by the second half slump…the index has ticked up slightly and is encountering the downtrend with a massive divergence on its RSI. My conclusion is that the worst is over and that we should now (or very soon) see the hard hit commodity prices lifting off their lows.
CHARTS: Dollar destruction of commodity prices could be ending

Thursday, November 27, 2014

Copper drops to three-week low on demand worries, aluminium up

Copper drops to three-week low on demand worries, aluminium up
* Weak U.S. home sales, consumer spending data
* Chinese speculators hit copper on Shanghai exchange
* London volumes retreat as Thanksgiving, year-end loom
* Nickel stocks rise to fresh record
(Reuters) - Copper fell to a three-week low on Wednesday after soft U.S. economic data and as Chinese speculators hit the market amid worries about weak demand.
Aluminium, however, gained on concern about shortages.
Three-month copper on the London Metal Exchange
(LME) fell to its lowest since Nov. 5 at $6,558 a tonne in intraday trade before paring losses to close 0.6 percent weaker at $6,570.
Volumes on the LME shrank ahead of the U.S. Thanksgiving Day holiday on Thursday.
"It has been a difficult year for speculators to make money and I don't think they are going to risk making bigger losses or eroding some of their gains in the final few weeks of the year, particularly when there aren't really any big stand out stories," said Gayle Berry, metals strategist at Jefferies.
On the Shanghai Futures Exchange, however, turnover climbed four-fold and open interest surged 11 percent as speculators sold copper, said analyst Leon Westgate at Standard Bank.
"With general sentiment at last week’s Asian Copper Week remaining negative... it appeared to be only a matter of time before the more bearish elements of the Chinese speculative community again had another go at shorting the metal."
The metal used in power and construction has been trading in a range between roughly $6,500 and $6,800 a tonne since mid-September and is down more than 10 percent this year.
It hit a three-week high of $6,772.50 a tonne last week following China's surprise interest rate cut. That cut may boost liquidity to businesses after about six months, said Colin Hamilton, head of commodity research at Macquarie.
"This is not an aggressive stimulus ... but it certainly underpins what we're looking at in terms of low single-digit growth rates for steel demand and mid single-digit growth rates for base metals demand into next year," he told a presentation.
Weak U.S. data on consumer and business spending added to jitters about global growth. 
Aluminium rose 0.6 percent to close at $2,061 a tonne as a key spread remained at the highest levels in nearly two years, indicating lack of spot material.
Nickel ended down 1.1 percent at $16,350 a tonne after LME stocks rose to a fresh all-time high.
Zinc finished up 0.1 percent at $2,273 a tonne, lead added 0.5 percent to $2,062.50 and tin rose 0.4 percent to close at $20,275.

Wednesday, November 26, 2014

Something Appears To Be Going On With Gold

Something appears to be happening to gold. That something is either China finally revealing its true gold inventory, which is unlikely, or, more likely, the biggest fat finger in the history of gold, as a liquidity testing algo goes absolutely insane in the pre-open period (and loses its job on the BIS' payroll). Or, most likely, just an ongoing bad print.
Something Appears To Be Going On With Gold

... and the algo, or the bad feed, or whatever, keeps going. $1400 now.
Something Appears To Be Going On With Gold


And... CTRL-Z. The liquidity test is complete as electronic market reopens for trading.
Something Appears To Be Going On With Gold
And for those curious to find out what happened, speak to the programmer of whatever the liquidity test was that moved gold higher by $0.10 every second in 1 contract in a diagonal fashion.
Something Appears To Be Going On With Gold

Intresting Study on S&P500

The last few weeks have been the strongest and most consistent rallies in US equity market history. US equity markets have traded above their 5-day moving average for 27 days – the longest such streak since March 1928  and all amid  GDP downgrades, missed PMIs, and downward earnings outlook revisions. Given the holiday week, it is hardly surprising volume was weak today.

27 days and counting for the S&P… an 86 year record… (within a year of this exuberance stocks had doubled and then halved from low)


Intresting Study on S&P500

This is what happened the last time the market did that…
Intresting Study on S&P500